mirror of
https://github.com/Kpa-clawbot/meshcore-analyzer.git
synced 2026-11-11 12:37:33 +00:00
202bafea28b2bb7e65f8e3147666faa2cc3cc609
56
Commits
| Author | SHA1 | Message | Date | |
|---|---|---|---|---|
 TeTeHackoandClaude Opus 5.5 |
77a5f14925 |
feat(observers): radio setting per observation from the observer's radio history (#1869) (#2292)
Part of #1869. ## Problem `observers.radio` keeps only the **last** `MHz,kHz,SF,CR` an observer reported. Once an observer is retuned (say from SF7 to the EU narrow SF8 setting to listen to a neighbouring mesh), every packet it ever heard reads as heard on the new setting, and there is no way to tell an SF7 packet from an SF8 one. ## What this does As #1869 proposes, the packet data model is untouched: the setting of an observation is resolved from its observer and time. **Ingestor** (all schema in `dbschema.Apply`) - `observer_radios`: one row per stretch of time an observer, and each radio of a multi-radio node, stayed on one setting. Every live status extends the current row and a change starts a new one; retained replays never extend a row. On the first run it is seeded with every observer's current radio, which is what the UI already showed for the past. - Settings are stored canonical through `dbschema.CanonicalRadio`, so `869.4320068,62.5,7,5` and `869.432,62.50,7,5` are one setting. - `observation_radios` (`observation_id → rx_radio_id`): multi-radio openHop nodes tag each packet with `rx_radio_id` and list `radios: [{id, radio}]` in their status, so their observations resolve per radio. - The table is sparse: single-radio nodes never send the field, so `observations` and every query that scans it stay untouched. - The row id comes from the observation upsert via `RETURNING id`. - Rows are pruned with their transmissions, and a purged observer takes its history along. **Server** (read-only) - No `AssertReady` change: an absent table reads as empty and is probed again later, the same rule as `advert_route_evidence`. - The history is held in memory. The live poller checks it on every tick (two primary-key lookups), so a retune or a new `rx_radio_id` is known before the observation is broadcast. A full reload runs every 10 min. - `radio` is added to observations, packets, grouped rows (taken from the header observation) and the live feed. - `GET /api/packets?radio=MHz,kHz,SF,CR` filters by setting. - Combined with `observer=`, it means *that* observer heard it on that setting. - A radio query is served from memory instead of falling back to SQL, which would return the window unfiltered. - `GET /api/radios` (named struct) and `radio_history` on `GET /api/observers/{id}`. **Frontend** - Packet filter fields `radio`, `freq`, `bw`, `sf`, `cr`, e.g. `sf == 8` or `freq > 869.5 && bw == 62.5`. - A Radio row in the packet detail and a Radio column in its observations table (only when the server reports one). - A radio history table on the observer page once there is more than one stretch. - `RfParams.radioText` formats the setting. It escapes all five characters and returns non-numeric input as it came, escaped. ## Performance `txMatchesRadio` runs once per observation inside `filterPackets`. - Each observation costs one map lookup by observer id. - Observers with a single stretch (nearly all) answer from that lookup directly. - Retuned observers add a binary search over their few stretches. - Multi-radio observers add one lookup by observation id. - The snapshot is loaded once per filter call. `BenchmarkTxMatchesRadio`, 30K packets / 150K observations (20 observers, 2 of them retuned): ``` BenchmarkTxMatchesRadio-24 602 2056924 ns/op 0 B/op 0 allocs/op ``` Memory is one entry per stretch plus one per multi-radio observation; nothing is added per observation otherwise. ## Tests - **dbschema:** seed runs once, canonical spellings, the tables exist without `observers.radio`. - **ingestor:** - stretches extend and split; canonical spellings do not split - two radios of one node hearing one transmission over two paths each keep their own radio - a retained status does not write history - prune and purge - `rx_radio_id` reaches `PacketData` - **server:** - resolution before, between and after stretches, and with an unknown radio id - `observer` + `radio`, and grouped rows carry `radio` - incremental refresh, `/api/radios`, `radio_history`, missing tables - the benchmark above - **frontend:** the new filter fields in `tests/unit/test-packet-filter.js`, and XSS cases through the real `RfParams.radioText` and the history renderer. - **E2E:** `tests/e2e/test-radio-setting-1869-e2e.js` checks the grouped rows' radio, `sf ==` on the packets page, the detail Radio row and the observer history. It is added to `scripts/non-unit-tests.json` and to shard 2. `go test -race` in `cmd/server`, `cmd/ingestor` and `internal/dbschema` passes, along with `sh test-all.sh`, `eslint@8` (0 errors) and the XSS diff gate. The new E2E test and `test-e2e-playwright.js` pass against the fixture. ## Browser validation This runs on a live instance with six observers, one of them retuned to 869.618/62.5/SF8/CR8: - The packet detail shows `Radio: 869.432 MHz · SF7 · BW 62.5 kHz · CR 4/5`. - `sf == 7` shows 106 of 106 grouped rows and `sf == 8` shows 0 of 107; the SF8 observer has not heard anything yet. - `/api/radios` lists both settings. - No page errors. ## Notes - **The customizer (rule 8)** gets nothing: the only constants are server-side refresh intervals. - **Attribution timing:** packets heard between a retune and the observer's next status message (minutes) are attributed to the previous setting, because a stretch starts when the status is handled. This is documented at `RecordObserverRadios`. 🤖 Generated with [Claude Code](https://claude.com/claude-code) Co-authored-by: Claude Opus 5.5 <noreply@anthropic.com> |
||
|
TeTeHackoandClaude Opus 5.5
|
684f89f200 |
feat(frontend): serve Leaflet, leaflet.heat and Chart.js from vendor/, not unpkg.com (#2299)
Refs #1554. `index.html`, `area-map.html` and `geofilter-builder.html` load Leaflet, leaflet.heat and Chart.js from **unpkg.com** on every page view. That causes three problems: - **Privacy:** every visitor sends a request to a third party. - **Availability:** where unpkg is blocked (script blockers, filtered networks) or down, the map and every chart are gone. The observer page then fails with `Error: Chart is not defined`. - **#1554:** the CSP target there, `script-src 'self'`, blocks these scripts just like the inline handlers the issue lists, but they are missing from its inventory. ## Change - **Vendored libraries:** `public/vendor/leaflet-1.9.4/` (with `images/`), `vendor/leaflet-heat-0.2.0.js` and `vendor/chart-4.5.1.umd.min.js`. - They are the unpkg dist files byte for byte, verified against the SRI hashes `index.html` already pins. - The two standalone pages loaded Leaflet without SRI; they now carry it. - This is the same pattern as `vendor/leaflet.markercluster.js`. - **`.gitattributes`:** `public/vendor/** -text`. Otherwise `* text=auto eol=lf` rewrites `leaflet.css`, which ships with CRLF, and the browser refuses it for the integrity mismatch. I hit exactly that while preparing this. - **`scripts/instrument-frontend.sh`:** now copies `vendor/` recursively. The flat `cp public/vendor/*` left the E2E server without `vendor/leaflet-1.9.4/`, which showed up as `L is not defined`. - **New test `tests/unit/test-vendored-libs.js`:** - no off-site `<script src>` or stylesheet in the served pages - every `integrity` attribute matches its vendored file - the images Leaflet's stylesheet references exist I checked that it fails against the old `index.html`. ## Checks - `sh test-all.sh` passes. - These E2E suites pass against the fixture: `test-e2e-playwright.js`, `test-analytics-fluid-charts.js`, `test-issue-1236-map-mobile-e2e.js` and `test-issue-1329-map-controls-accordion-e2e.js`. - On a live instance, a headless browser with `unpkg.com`, `jsdelivr` and `cdnjs` blocked: - the observer page renders all four charts - the map loads tiles and markers - `typeof L` and `typeof Chart` are defined - no CDN request is made and no page error occurs ## Not in this PR Swagger UI on `/api/docs` (`cmd/server/openapi.go`) still loads `swagger-ui-dist` from unpkg. I can vendor it in a follow-up if wanted. 🤖 Generated with [Claude Code](https://claude.com/claude-code) Co-authored-by: Claude Opus 5.5 <noreply@anthropic.com> |
||
|
n30nex
|
e61ff6e473 |
fix(observers): keep detail responses tied to the current view (#2323)
Fixes #2316 and #2320. Related to #1778; progressive loading remains separate. Delayed observer responses could replace a newer observer or period, overwrite its error/status/calibration, and leave detached charts alive. Each load now captures its observer and days and checks ownership before success or failure can update the view. Leaving the page invalidates pending loads, including same-observer revisits. New visits also reset the request window to the selector's existing seven-day default. Previously, a new page could display seven days while requesting the preceding visit's 30-day window. Production change: 12 added lines and three replacements in one frontend file. No new requests, caches, settings or dependencies; the ownership check is O(1). Existing request deduplication, comparison controls, chart cleanup and current-request errors are preserved. Validation: 11 unit checks, all 219 standalone suites, 32 controlled browser cases across desktop/mobile and both themes, comparison 9/9, and observer-IATA 5/5. Core browser run exited successfully with 149 passes and three declared fixture skips; existing conditional subchecks remain. The unchanged backend tree passed both full backend suites. The parent independently reran the new unit/browser tests. Test-only RED `a73c227f` produced [nine unit and 28 browser assertion failures](https://github.com/Kpa-clawbot/CoreScope/actions/runs/40239824064). Three independent reviews passed. [Final-head CI](https://github.com/Kpa-clawbot/CoreScope/actions/runs/40240673369) passes on `ba52d873` integrated with upstream `11ce1235`, including all browser shards and architecture builds. |
||
|
efitenandClaude Opus 5.5
|
dc98886d92 |
feat(nodes): name and show repeaters known only from the name they reported (#2238) (#2239)
Part of #2238. Path hops through such a repeater (`/api/nodes`, `/api/resolve-hops`, the frontend hop resolver) still show a bare prefix; that part of the issue stays open. ## Summary A repeater that never sends an advert can still tell a nearby companion its name. CoreDrive RX v1.20.0 asks for it (`ANON_REQ_TYPE_OWNER`) and publishes the answer as `NODE_NAME` on `meshcore/client/{pk}/names`. This PR stores those answers, resolves names with them, and shows these repeaters on the map, in the nodes list and in search, marked as self-reported. ### Ingestor: store the names - `367ecde1` adds a new `names` subtopic. - It is gated on `clientNodeNames.enabled`, default off. - Answers go into a new table, `client_node_names`: one row per observation, `UNIQUE(target, rx_pubkey, observed_at)`. - **Validation.** - `target` must be 64 hex. - The name is trimmed and rejected when it is empty, over 31 runes (firmware `node_name[32]`, `src/helpers/CommonCLI.h:29`), invalid UTF-8, or contains a control character. - **Retention.** `retention.clientNodeNamesDays` (0 = keep). `config.example.json` sets 30, like the other client tables: a companion only asks a repeater for its name when CoreScope has none (`nameMissing` in CoreDrive's `src/names.js`), so pruning is also how a renamed repeater gets its new name. - **Compatibility.** An ingestor without this change drops `/names` silently, so CoreDrive v1.20.0 works against either version. ### Server: resolve by the reported name - `11d97b36` makes `lookupPrefixes` count candidates in both `nodes` and `client_node_names`. `/api/nodes/resolve` and `batchResolveHeardKeys` (the coverage tooltips) both use it. - **Which name wins.** The advert name, otherwise the newest reported name by `observed_at`. A prefix that matches different pubkeys across the two tables stays ambiguous. - **Only repeaters heard directly.** A reported name counts only once its target has at least one `discover` or `advert` reception in `client_receptions`, keyed by the full pubkey, or by its 8-byte prefix when no other pubkey in `nodes`, `inactive_nodes` or `client_node_names` starts with that prefix (`clientNameHeard`). A name for a pubkey nobody heard adds no candidate, so it cannot make a real node's prefix ambiguous. Without the uniqueness check, a made-up pubkey that shares a heard repeater's first 8 bytes borrowed that repeater's receptions and passed (fixed in `4c569f91`). - **Filters.** The blacklist and the hidden name prefixes apply to both sources. - **Missing table.** A database without the table resolves from `nodes` alone, and the server checks for the table again until the ingestor has created it. - **Response shape.** `/api/nodes/resolve` keeps `{prefix, pubkey?, name?, ambiguous}`. ### Server: estimated position - `98c76957` adds `GET /api/nodes/reported`, documented in `openapi.go`. It lists every repeater in `client_node_names` that never sent an advert (no row in `nodes` or `inactive_nodes`) and was heard directly at least once (see above). A node with an advert but no position stays out: it is already in `/api/nodes` under its advert name. - **Gated** like the other endpoints on `client_receptions`: 404 when `clientRxCoverage.enabled` is off, because the counts and the estimate come from companion GPS fixes. - **Which receptions count.** Only direct ones: - `discover` and `advert` rows, keyed by the full pubkey, or by its 8-byte prefix when no other known pubkey shares it; - `rxlog` rows whose 2-3 byte hash resolves to this repeater alone. `geo` rows are left out. - **How the estimate is made.** - Receptions within 100 m form one spot, with the best SNR of that spot. - An estimate needs at least 3 spots, at least 200 m apart. - The position is the SNR-weighted centroid (`10^(snr/20)`). The radius is the distance to the farthest spot, at least 500 m. - The response is cached for 5 minutes, and the compute time is logged. ### Map - `5fcde554` adds `public/map-estimated.js`, which draws each estimate on its own layer: - a hollow, dashed "≈" marker and a dashed uncertainty circle; - a popup with an "Estimated position" badge, the method, the caveat that one-sided driving skews the estimate, and a link to the coverage map; - a Display toggle, "Estimated positions": on by default, kept in localStorage, and also hidden by the repeater role filter and in route view. ### Nodes page and search - `12e6b345` adds a "Self-reported repeaters" section under the nodes table, on the All and Repeaters tabs, filtered by the search box. - **`#/nodes/<pubkey>`.** Where `/api/nodes/<pubkey>` answers 404, a self-reported detail view replaces "Node not found": - who reported the name; - the receptions; - the estimate, or why there is none; - links to the map and the coverage map. An unknown key still shows "Node not found". - **Header search** adds matching self-reported repeaters, tagged "self-reported". - **Unchanged on purpose.** `/api/nodes` and `/api/nodes/search` stay as they are. These repeaters have no packets, so the packet filters, the live view and the channel sender lookup must not match them. ### Docs - `03580437` corrects the `/regions` section of `docs/client-rx-coverage.md`: it named `clientRxCoverage.enabled` as the switch, but the code uses `clientRegions.enabled`. - The new subtopic, endpoint and config keys are documented in the same file. ## Trust Any companion the broker lets publish can report a name for any repeater, and the newest report wins. This is the same model as `/regions`. `clientRxCoverage.requireLinkedCompanion` limits it to linked companions. A report for a repeater nobody heard directly is stored but not used: it is not listed and adds no prefix candidate. A companion can still report a wrong name for a repeater that was heard. The same companion can also publish a fake `discover` reception for a made-up pubkey, so the "heard directly" check filters junk, not a malicious companion; `requireLinkedCompanion` is the control for that (its gate runs before the `/names` handler too). ## Performance - **`lookupPrefixes`** adds one term per key on `client_node_names`. - It matches the prefix as a range, `target >= ? AND target < ?` (upper bound prefix + `"g"`), not with `LIKE`: `LIKE` on this case-sensitive column cannot use the index. `EXPLAIN QUERY PLAN`: `SEARCH c USING INDEX idx_cnn_target (target>? AND target<?)`, and the reception check is `SEARCH r USING INDEX idx_client_recept_heard_geo (heard_key=?)`. - It is still one query per chunk of 200 keys: 400 compound terms, under SQLite's default limit of 500. - `TestLookupPrefixesManyKeys` covers 250 keys over two chunks. - **`/api/nodes/reported`** makes three kinds of query: - one grouped query on `client_node_names`; - one `lookupPrefixes` call for the short hashes; - one `IN` query per 400 keys on `client_receptions`, served by `idx_client_recept_heard_geo`. The spread check is O(spots²) per repeater, with at most one spot per 100 m visited. The result is cached for 5 minutes; concurrent misses wait for one computation, and the response is written after the lock is released. - **The map does not wait for it.** It draws its markers first and adds the estimates when the list arrives. The map and the nodes page share one cached fetch (`ReportedNodes.load()`). - **Not benchmarked.** On the instance where this runs, `client_node_names` holds one row today. I expect at most tens of such repeaters per instance, but have not measured that. ## Notes - **`map[string]interface{}`.** `cmd/ingestor/client_names.go` has 2 occurrences: the handler's `msg` parameter and its `gps` field. That is the decoded MQTT message, passed in the same shape as `handleClientPacket` and `handleClientRegions` already take it. No API response or internal structure uses it. - **Thresholds are hardcoded:** 100 m, 3 spots / 200 m, 500 m, 5 min TTL. They should move to the customizer later (rule 8). - **Map filters.** The estimates follow the "Estimated positions" toggle and the repeater role filter, not the area, region or last-heard filters. The toggle's tooltip says so. - **Name characters.** Names are rejected for control characters but not for Unicode format characters (bidi overrides, zero-width joiners), because emoji sequences in node names use the zero-width joiner. All output goes through `escapeHtml`. - **Not done:** the home-page search box (`home.js`, `/api/nodes/search` with a Claim button) does not list these repeaters. Claiming a node without adverts would have nothing to show. ## Tests On this branch (based on `550829af`): - `go vet ./...` and `go test -count=1 ./...` pass in `cmd/server` and `cmd/ingestor`. - **New Go tests:** - handler and validation cases; - idempotent redelivery; - newest `observed_at` wins; - prune; - the gate on and off, without falling through to the observer path; - client-only node, nameless `nodes` row, advert name wins, ambiguity across the two sources; - hidden and blacklisted nodes; - absent-then-created table; - spot merging, threshold, weighted centroid and radius floor; - `discover` / `rxlog` / `geo` handling, an ambiguous path hash, an advert position and a missing table; - an advert without a position, a never-heard name, a name heard only in `rxlog` paths, and the `clientRxCoverage` gate (404). These fail on `12e6b345` and pass at head. - a made-up pubkey sharing a heard repeater's 8-byte prefix, and two reported targets sharing one (`4c569f91`). Both fail without that commit. - **New frontend unit suites:** `tests/unit/test-map-estimated.js` and `tests/unit/test-reported-nodes.js` pass. Both load the real `escapeHtml` from `app.js`. - **`test-all.sh`** passes, all suites (with Python available for the XSS gate self-tests). `scripts/check-xss-sinks.sh --file` passes on the four changed frontend files. - **E2E**, against a static server with a mocked API: - `test-map-estimated-e2e.js`: 6/6, including the repeater role filter and route view hiding the estimates. Mutating either hide makes its step fail. - `test-reported-nodes-e2e.js`: 6/6. - `test-issue-1150-404-state-e2e.js`: 5/5. - **Real data, API only.** On the fork's staging, `/api/nodes/reported` lists one repeater: 5 spots, 17 receptions, an estimate with a radius of 2,305 m. It has no `nodes` row and 24 `discover` receptions, so it stays listed under the stricter rules. Not re-checked after `4c569f91`. - **Not done:** a check of that repeater in a browser. --------- Co-authored-by: Claude Opus 5.5 <noreply@anthropic.com> |
||
|
efitenandClaude Opus 5.5
|
d43f3c3777 |
feat(theme): ?theme=dark|light URL parameter for one page load (#2236) (#2251)
Fixes #2236. A display that can only be given a URL (digital signage, an iframe without cookies or login) had no way to choose dark or light. This adds `theme=dark` or `theme=light` to the hash query, next to `embed=1`: ``` https://<instance>/#/map?embed=1&theme=dark ``` ## What changes **`public/index.html`, the pre-paint script** - Reads `theme` from the hash query with `URLSearchParams`, as `shouldEmbedRoute` does for `embed`. Only `dark` and `light` count; anything else is ignored. - A valid value wins over the saved choice and the OS preference, and is set before first paint, so there is no light flash. - The value is handed to `app.js` as `window.__themeOverride`. - When `localStorage` throws (a sandboxed iframe), the URL value is still applied. **`public/app.js`, the dark-mode setup** - On load, a URL value is applied through `applyTheme(theme, false)`, which does not write `meshcore-theme`. The saved choice, and the account settings that `settings-sync.js` syncs from that key, stay as they were. - Theme changes from other tabs or from settings sync (the `storage` listener) are ignored while the URL value holds. Otherwise a logged-in display would flip within a minute. - A click on the dark-mode toggle ends the URL value and is saved as before. It works on every page, not only on the two `embed=1` pages. The value is read once per page load, so later hash changes (navigation, map viewport) keep it. ## Tests | File | Assertions | Covers | |---|---|---| | `tests/unit/test-theme-url-param-2236.js` | 8 | Runs the real pre-paint script from `index.html`: `dark` and `light` win over a saved choice and the OS, nothing is written to `localStorage`, any page and position in the query, an unknown value, no param, `localStorage` throwing | | `tests/e2e/test-theme-url-param-2236-e2e.js` | 6 steps | `#/map?embed=1&theme=dark` over a saved "light" (dark, embed, saved still "light"), a reload without the param, `theme=light` over a saved "dark", a storage event while the override holds, the toggle ending it, `theme=blue` | How I checked them: - With `index.html` and `app.js` from master, 6 of the 8 unit assertions fail, and the E2E fails at step 1 ("expected dark + embed + saved light"). - With only the `app.js` change reverted, the E2E fails at step 1. With only the `if (themeOverride) return;` line in the `storage` listener removed, it fails at step 4. - `sh test-all.sh` passes, except `test-issue-1956-release-routing.js`, which I skipped: it needs the workflow's `GITHUB_REF_NAME` and does not run in local git-bash. `npx eslint public/app.js` reports 0 errors (18 warnings, the same count as master). - E2E on a fixture seeded as in CI: | Suite | Result | |---|---| | `test-e2e-playwright.js` | 148 passed, 3 skipped | | `test-customize-theme-e2e.js` | 8/8 | | the new #2236 suite | 6/6 | - `test-logo-theme-e2e.js` fails locally with "wordmark `<text>` overflows SVG viewBox", with the same numbers on master. It measures font metrics, which differ on this Windows machine. The new E2E is registered in `scripts/non-unit-tests.json` and `deploy.yml` (shard 2, next to the logo theme suites); the unit test is in `test-all.sh`. ## Not done - No screenshot: the E2E checks `data-theme` in headless Chromium, not how the page looks. - `live.js` Matrix mode forces dark and, when switched off, saves the theme it restores. With a URL value active, turning Matrix off saves that value as the stored choice. I left this as is, because a display that only shows a URL does not toggle Matrix mode. - Only `theme=`; the `?darkMode=1` form from the issue text is not supported, so there is one form to document. - I placed the E2E in shard 2 without measuring suite times. Co-authored-by: Claude Opus 5.5 <noreply@anthropic.com> |
||
|
efitenandClaude Opus 5.5
|
3960fadd96 |
fix(pages): drop late responses that belong to an earlier page visit (#2218, #2230, #2200) (#2248)
Fixes #2218, fixes #2230, fixes #2200. Node analytics, the account page and analytics await their data, then write into the shared `#app` container. A response that lands after the user has navigated away replaces the new page. In #2218's reproduction, the Nodes list, with 200 rows, became an Analytics heading. ## The shared part `public/app.js` keeps one view generation, `viewGeneration()`: - `navigate()` bumps it before the old page's `destroy()`, so every page init counts as a new visit, including a switch to another node of the same page type. - A page captures the value at init, and after each `await` drops the result when the value has moved on. `.eslintrc.json` declares it as a global. ## Per page **#2218, `node-analytics.js`** - `loadAnalytics` and `loadBatteryChart` check the generation on both success and error. A page-local `loadSeq` makes a time-range click a new load on the same visit, so an older range can't land over a newer one. - `NodeHopAnalytics.load` already checked `container.isConnected`, so it is unchanged. **#2230, `account.js`** - The render after `CSAuth.ready()` runs only while the generation is unchanged. - `destroy()` was empty. It now clears `shown.app` and `shown.userId`. **#2200, `analytics.js`** - A page-local `_loadSeq` sits next to the generation. Results and errors of an older window/region selection or an earlier visit are dropped, so a late failure of an old load no longer shows an error over newer results. - The bulk load renders only the six tabs drawn from its data. A tab that loads its own data (Prefix Tool, Nodes, Roles, ...) is no longer rebuilt or replaced by the bulk result: a deep-linked one renders at init, and a window, region or area change re-renders it directly. - `renderTab` guards the six tabs drawn from the bulk data (overview, rf, topology, channels, hashsizes, collisions). Until the data arrives they show "Loading analytics…", or the current load's error. Overview no longer dereferences an undefined `rf`. - Three related fixes in the same lines: - The error message is now escaped with `esc()`; it was inserted raw. - `destroy()` removes the RegionFilter and AreaFilter listeners. They piled up on every visit and called `loadAnalytics` from other pages. - `destroy()` resets the stored error. ## Tests | File | Assertions | Covers | |---|---|---| | `tests/unit/test-issue-2218-node-analytics-stale-render.js` | 12 | Loads the real router: the generation rises on every init, including another node. Late success and error after leaving, a stale visit of the same node, an older range landing last, late battery success and error. The current response, battery and error still render | | `tests/unit/test-issue-2230-account-stale-render.js` | 6 | Leaving before ready (login view and "not enabled"), re-entering before ready, the current render, an auth change after `destroy()` | | `tests/unit/test-issue-2200-analytics-stale-load.js` | 19 | An older selection landing last, a late rejection of an older selection, leave and re-enter (success and error), the current error rendered escaped and kept on a tab click, Overview and RF clicked before the data | | `tests/e2e/test-issue-2218-node-analytics-stale-e2e.js` | 4 steps | Holds `/api/nodes/*/analytics` with `page.route`, returns to `#/nodes`, then releases the response as a 200 and as a 500. The 200 rows stay and no Analytics heading appears; a normal visit still renders | How I checked them: - With the production files reverted and the tests kept, 7 of 12, 4 of 6 and 7 of 12 unit assertions fail. With the fix, all pass. - The E2E fails on the unfixed frontend with "Nodes rows 200 before release, 0 after". - Single mutations, each reverted: - removing the success check in `loadAnalytics` (analytics) fails 2 assertions; - removing the check after `CSAuth.ready()` fails 3. Other test changes: - `test-analytics-theme-refresh-before-data.js` and `test-user-management-ui.js` get a `viewGeneration: () => 0` stub. - The new E2E is registered in `scripts/non-unit-tests.json` and `deploy.yml` (shard 2, next to the #748 suite). The unit tests are in `test-all.sh`. - The broad suite's "Node side panel Details link navigates" test selected an anchor that now opens Analytics, as #2218 notes. It now clicks `#nodesRight .node-detail-btn`. Results: - `sh test-all.sh` passes, and `npx eslint public/*.js` reports 0 errors. - E2E on a fixture seeded as in CI: | Suite | Result | |---|---| | `test-e2e-playwright.js` | 148 passed, 3 skipped | | `test-user-management-e2e.js` | 28/28 | | the new #2218 suite | 4/4 | | `test-issue-748-node-analytics-coverage-e2e.js` | 2/2 | | `test-analytics-fluid-charts.js` | 8/8 | | `test-issue-1657-analytics-channels-group-sprites-e2e.js` | 5/5 | ## Not done - Two tabs that each fetch their own data can still overwrite each other after a fast tab switch between them. #2200 does not ask for that. - `nodes.js` `navigateToNode` calls its own `init` without the router, so it does not bump the generation. None of the three pages fixed here depends on that. - I placed the E2E in shard 2 without measuring suite times, which the `deploy.yml` comment asks for. --------- Co-authored-by: Claude Opus 5.5 <noreply@anthropic.com> |
||
|
CoderNemesisandClaude Opus 5.5
|
e55c95db24 |
1-Byte Hop Path Inference for Packet and Map Analysis (#2245)
## Summary On meshes with 1-byte path hashes, most hop prefixes are shared by several repeaters. The packet detail pane currently resolves each hop on its own and stores the result by prefix. Two things go wrong as a result: - A prefix that appears twice in one path resolves to the same node both times. - Nothing checks that the chosen hops form a path a packet could actually take. This PR adds `HopResolver.inferPath()`, which infers the most likely node behind every hop of **one observation's path**, scoring the path as a whole and anchoring it on the observer that heard it. The packet detail pane and the map route view now use it, so both show the same nodes for the selected observation (`?obs=`). ## The problem, on a real packet Packet `57da37d1636f895a`, observation `1388126`: a 46-hop flood with 1-byte hashes. The server's `resolved_path` resolved 1 hop of 46, so the client resolver did the rest. Eight prefixes appear twice in the path. | | Current resolver | `inferPath()` | |---|---|---| | Hops longer than 120 km | 13 (21 longer than 60 km, two over 950 km) | 0 | | Distance from the last hop to the observer | 59 km | 0.1 km | | Hops reported as unlisted (no listed node fits) | 0, every hop guessed | 13 | | Agreement on the shared path prefix across the packet's 23 observations | — | 97.8% | The current resolver picks badly for three reasons: 1. **Results are keyed by prefix.** Hop 0 and hop 45 share a prefix, so both show the node near the start of the path, 59 km from the observer. 2. **Picks are greedy.** Each hop looks only at its nearest resolved neighbours, so nothing penalises a 1,100 km jump. 3. **The detail pane read the wrong `resolved_path`.** It used the packet row's, not the selected observation's, and when the lengths matched it never fell back for the hops that were `null`. ## Firmware basis The model relies on two facts from `firmware/src/Mesh.cpp`: - **The last hop is the one the observer heard.** `Mesh::routeRecvPacket` appends the relaying node's own hash to the end of a flood path. - **A node appears at most once in a flood path.** A node forwards a given packet once: `_tables->wasSeen()` / `markSeen()`. ## How the model works Each hop is either one of the **located** repeaters or room servers sharing its prefix, or **unlisted**: a node missing from the node list, or one without GPS. With 1-byte prefixes, unlisted is common, and naming it beats drawing a 300 km hop. | Term | Cost | |---|---| | A hop between two located nodes | distance / 50 km; past 100 km per hop, the cost rises 4× faster | | A hop with a neighbour-graph link | the distance cost × 0.5 | | An unlisted hop | 1.6, flat (about one 80 km hop) | | The last hop to the observer | the same distance cost; falls back to the observer's IATA region centre (with 50 km slack) when the observer reports no GPS or 0,0 | | The first hop to the sender | the same distance cost, when the sender's position is known (e.g. an ADVERT) | - **Search:** dynamic programming over (hop, candidate) finds the cheapest sequence. When the best path uses a node twice, the node is banned from whichever position costs less to give up. - **Confidence:** each hop's confidence comes from the min-marginal costs of its alternatives, put through a softmax. A node the path already uses at another hop is not counted as an alternative. - **Server hint:** the observation's own `resolved_path` restricts a hop to the named node, but that hop can still be reported unlisted if the node doesn't fit. The tuning values live in `PATH_MODEL` in `hop-resolver.js`, with a TODO to expose them in the customizer (AGENTS rule 8). ## What changes in the UI **Packet detail pane** (`packets.js`): - The Path row, the cross-observer aggregate row and the byte breakdown render hops **by position**, from the inferred entries. - The detail pane no longer writes into the list's shared per-prefix cache (`hopNameCache`), so it can't change what the packets list shows. **Hop display** (`hop-display.js`): | Hop state | Display | |---|---| | Confident (≥ 70%) | The node's name; the tooltip says `NN% likely` and how many nodes share the prefix | | A guess (< 70%) | Dashed underline, plus a candidate badge when there are alternatives | | Unlisted | The hex prefix in muted text; the badge lists the rejected candidates | | The only known node, without GPS | The name, with `(no GPS)` | The candidate popover lists each candidate with its likelihood, or `hop N` when the path uses that node elsewhere. The "Path symbols" legend gains an entry for unlisted hops. **Map route view** (`map.js`, `route-view.js`): - The `#/map?packet=…&obs=…` deep link infers the chosen observation's hops with the same shared helper, so the map and the detail pane agree. - Unlisted hops render as `unlisted` placeholders rather than as the nearest node that happens to share the prefix. - When inferred hops are available, the `/api/resolve-hops` request is skipped. **Shared helpers** (`packet-helpers.js`): - `inferObservationPath(obs, observerPos, originPos)` - `ensureHopAffinity()`: loads the neighbour graph once per page, cached by `api()` for 5 minutes. - `routeHopFromInferred(hop, entry, role)` **Cleanup:** removed dead hop resolution from the "View route on map" button handler. It computed hops, sender and recipient, then navigated by URL and discarded them. **Unchanged:** the packets list, live view, node pages and `HopResolver.resolve()`. ## Performance AGENTS rule 0 asks for proof of performance claims; the figures follow. - **Complexity:** O(hops × 8 × candidates²). Hops more than 8 positions apart aren't compared directly; a longer run of unlisted hops costs a flat amount, tracked with a running minimum. Hop-to-hop costs are computed once and reused by every pass. - **Where it runs:** once per detail render (plus once for the aggregate row) and once per map deep link. Nothing runs in the list, live feed or WebSocket paths. - **Measured** (Node 22, warm JIT): | Case | Time | |---|---| | 64 hops × 16 candidates, synthetic worst case | 9–14 ms median | | Real 39–48 hop paths, 1,153 nodes (23 observations) | 1–12 ms each | - **Enforced:** `test-hop-path-inference.js` asserts a median under 40 ms (target 20 ms) for the 64 × 16 case. It times the module outside Node's `vm` sandbox, because the sandbox makes global lookups about 10× slower than a browser. - **Network:** one extra bulk request per page life (`/api/analytics/neighbor-graph`, cached server-side, TTL 5 min). No per-hop or per-packet requests. ## Tests **New:** - `tests/unit/test-hop-path-inference.js` (37 assertions). The model itself: - a repeated prefix resolves per position, and no node appears twice; - the observer anchors the last hop, with the IATA fallback when the observer has no position or reports 0,0; - a far-away lone candidate is reported unlisted; - a neighbour-graph link breaks a tie; - the server hint and the origin anchor are applied; - a node without GPS is handled; - output shape, and the performance gate. - `tests/unit/test-hop-path-detail.js` (32 assertions). Rendering and wiring: - inferred-hop rendering and the popover; - positional `renderPath`, including with the 1-byte hop filter on; - `renderDetail` infers the shown observation from its own `resolved_path` and leaves the list cache alone; - the neighbour graph is fetched once; - the shared map helpers, and source checks on the map wiring. - `tests/e2e/test-hop-path-inference-e2e.js` (6 steps, shard 1). Runs on fixture packet `57224a4a01c9c682`, observation 147, a 22-hop path that repeats one prefix three times: - every hop is inferred; - the repeats resolve per position; - the popover shows likelihoods; - the map's route list matches the detail pane hop for hop. **Updated, because they pinned the old behaviour:** - `test-issue-1418-deeplink-hops-channels.js`: it tested a copy of the old map priority logic. It now tests the real `inferObservationPath()`, including `resolved_path` as a hint. - `test-issue-2098-last-hop-region.js`: the detail pane no longer writes the prefix cache. The test now reads the region-anchored last hop from the rendered Path row. - `test-issue-2097-hop-ambiguity-badge.js`: the source check allows the new `entries` option while still asserting that the detail pane never uses the summarised form. - `.eslintrc.json`: declares the three new shared helpers as globals. **Results on this branch:** - `sh test-all.sh`: all standalone frontend suites pass. - `npx eslint public/*.js`: 0 errors. All 85 warnings are pre-existing; none come from code this PR adds. - The "Run Playwright E2E tests (fail-fast)" step was run locally with its script taken verbatim from `deploy.yml` (`bash -eo pipefail`, fixture prepared as in CI): - shard 1: 27 of 27 passed; - shard 2: 47 of 47 passed; - shard 3: 50 of 50 passed. Note for reviewers: `test-issue-1692-packets-init-parallel-e2e.js` only passes while the freshened fixture's newest packets are less than 15 minutes old. The test sets the time window in `localStorage` after the page has already read it. CI meets that condition because shards start right after freshening. Unmodified `master` fails the same way when run late. **Browser validation:** the local server ran on the fixture DB. Checked in the browser: - the Path row, the candidate popover and the byte breakdown; - the map route view, which matched the detail pane hop for hop with unlisted placeholders; - the console showed no errors. ## Known limitations and follow-ups - **TRACE packets are not modelled yet.** A TRACE's path is its *planned* route. The header path byte counts the hops actually forwarded (repeaters append SNR, not their hash, `Mesh.cpp`), and a trace may revisit a node on its way back (see the comment in `Packet::calculatePacketHash`). A follow-up will add a `heardAfter` / `allowRepeats` option, so a trace is anchored after the hops it actually completed and may repeat nodes. - **Customizer (AGENTS rule 8):** the `PATH_MODEL` tuning values are hardcoded for now. The unlisted cost, typical and maximum hop length, and the confidence threshold should become customizer settings. - **Server-side `resolved_path`:** the ingestor writes a hop as resolved whenever its prefix is unique in the node table, even when that node is hundreds of km from the neighbouring hops. `inferPath()` treats these as hints and can overrule them, but the stored data is still misleading. - **The first hop without a sender position is often a close call.** On encrypted channel messages, hop 0 is constrained only by what follows it, so 55/45-style splits between a long chain of known nodes and "unlisted" are expected. The badge and the percentage show this rather than hide it. ## Screenshots This is what a normal corescope instance would show for a 1 byte path. <img width="318" height="338" alt="image" src="https://github.com/user-attachments/assets/4056bc27-0b37-4107-9b25-31ac0f7864ec" /> <img width="430" height="601" alt="image" src="https://github.com/user-attachments/assets/01da5ee8-babf-4e41-a9ab-836b5d640549" /> Now the same packet but with the logic to infer each hope along the path different nodes are chosen as they're ranked and selected based on proximity to the next hop, <img width="436" height="646" alt="image" src="https://github.com/user-attachments/assets/bcca73b8-daf0-4031-8ea1-8c96d716c8b3" /> <img width="436" height="646" alt="image" src="https://github.com/user-attachments/assets/fc926d9e-158c-48ce-bee6-93086afb0775" /> The higher the confidence level then there's no need to show the exclamation mark to show that multiple nodes share the same prefix but it does continue to share that Examples of it currently running can be found at, https://corescope.baymc.org - modified instance https://analyzer.comchan.net - unmodified instance https://analyzer-stage.comchan.net - modified instance --------- Co-authored-by: Claude Opus 5.5 <noreply@anthropic.com> |
||
|
efitenandClaude Opus 5.5
|
2d09335cfb |
fix(packets): keep the node filter pick on a slow click or late search (#2243) (#2244)
Fixes #2243. ## Problem The packets node filter selected a suggestion on `click`, while the input's `blur` handler hides the dropdown 200 ms after focus leaves. A press held longer than that, or a search response that rebuilt the list between mousedown and mouseup, lost the pick: the typed text stayed and no `node=` filter was applied. ## Change - `public/packets.js`: suggestions select on `mousedown` with `preventDefault`, so the input keeps focus and the pick happens before any rebuild. `live.js` already does this for its node filter. - `public/packets.js`: a sequence counter drops search responses for an older query, bumped on every search and on a pick, so a late response can't replace or reopen the list. - `tests/e2e/test-packets-node-filter-e2e.js` (new), registered in `scripts/non-unit-tests.json` and on shard 1 in `deploy.yml`. ## Tests The new E2E has three cases: a normal click, a 400 ms press, and a search response released mid-click. | Code | Normal click | 400 ms press | Response mid-click | |---|---|---|---| | master | pass | fail | fail | | this PR without the sequence guard | pass | pass | fail (list reopens) | | this PR | pass | pass | pass | Run locally against the freshened e2e fixture. `sh test-all.sh` passes (locally `test-preflight-xss-gate.js` needs a real `python3` on PATH and `PYTHONUTF8=1`, unrelated to this change). ## Not done - Full `test-e2e-playwright.js` not run locally. - Could not reproduce on the reporter's instance with the browser tool, whose clicks are shorter than 200 ms. The 400 ms Playwright press reproduces it on the fixture. - `live.js` and `packets.js` still carry two separate node-autocomplete implementations. Merging them is out of scope here. Co-authored-by: Claude Opus 5.5 <noreply@anthropic.com> |
||
|
|
127dd511a7 |
fix(health): judge favorites and home status cards by the node's role (#2215)
## The problem A starred repeater can show two different health statuses. The My Repeaters tab (#1761) and `getNodeStatus` judge it by the infra thresholds (degraded after 24 h, silent after 72 h). The favorites dropdown and the home page cards judge every node by the node thresholds (degraded after 1 h, silent after 24 h), because they never look at the node's role. | repeater last heard | favorites / home cards (before) | My Repeaters tab | after this PR | |---|---|---|---| | 5 h ago | degraded | healthy | healthy | | 30 h ago | silent | degraded | degraded | | 80 h ago | silent | silent | silent | If you set `healthThresholds` in `config.json`, every view follows your values. ## The change Three call sites now use `getHealthThresholds(role)`, the helper the My Repeaters tab already uses: - `renderFavDropdown` in `app.js` - the "My Nodes" grid card in `home.js` - the hero search-result card in `home.js` The search card's fallback text, "Not heard in 24+ hours", was only true for non-infra nodes, so it now reads "Not heard recently". ## Scope - I kept the existing three-state healthy / degraded / silent logic and changed only which thresholds apply. - Not included: counting a repeater that is relaying traffic as alive (#1598, which `getNodeStatus` does). That is a bigger behavior change and would be its own PR. ## Risk Low. It is 9 lines in two files, and the helper and thresholds already exist and are used elsewhere. ## Tests New `tests/unit/test-health-card-role-thresholds.js`, added to `test-all.sh`. It checks that infra roles get looser thresholds than nodes, and that each of the three call sites goes through `getHealthThresholds(role)` with no node-only comparison left. On current `master` 5 of its 7 assertions fail; with this change all pass. `sh test-all.sh` passes. It prints a `STALE ALLOWLIST` warning from an a11y self-test, which it also does on `master`. ## Update after review (commit `0f2376df`) The text above is the description efiten reviewed on 2026-10-15. This section describes the code as it is now. ### The change - New `getHealthStatus(role, heard, now)` in `roles.js`. It returns `healthy`, `degraded` or `silent` by the role's thresholds, or `null` when there is no usable timestamp. It only applies the cut-offs; each caller picks the timestamp. - All six places that compared an age against `degradedMs` / `silentMs` now call it: - the favorites dropdown (`app.js`); - the "My Nodes" card and the home health card (`home.js`); - the analytics network status and My Repeaters (`analytics.js`); - the live node panel (`live.js`). Each keeps its own labels and timestamp, so the last three show the same as before. `analytics.js` and `live.js` no longer guard with `typeof getHealthThresholds`. `roles.js` loads before both, and both already used it without a guard elsewhere: the old network status called `getHealthThresholds` directly, and `live.js` reads `ROLE_COLORS`. - The favorites dropdown and both home cards now fall back to the node's `last_seen` when the packet store has no packet for it. My Repeaters (`last_heard || last_seen`) and the node page (`nodes.js:729`) already do this. Without it, with a packet store window under 72 h, a repeater could be silent on the cards and degraded on My Repeaters. The "ago" text uses the same timestamp. With the default thresholds, the fallback changes a status only when the packet store holds less than 72 h of packets. `retentionHours` unset (unlimited) or at the example's 168 h holds more than that. Otherwise a node with no packet in the window is silent either way, and the views now show how long ago it was last seen instead of "never" or nothing. - With no timestamp at all, the home health card said "Not heard in 24+ hours". It now says "No packets in the current window". ### Why a new helper and not `getNodeStatus` `getNodeStatus` has two states (active / stale) and counts a repeater that relays traffic as alive (#1598). Using it here would change more than the thresholds. `getHealthStatus` keeps these views' three states. ### Scope - Not included: counting a repeater that relays traffic as alive (#1598) in these views. That is a bigger behavior change and would be its own PR. - The live node panel still judges by `last_seen` alone, and the node page stays relay-aware. Both now use the shared thresholds; aligning their timestamps would also be its own change. ### Tests - `tests/unit/test-health-status.js` runs `roles.js` in `vm`. It covers: - repeater, room, companion, sensor, an unknown role and a missing role, at ages either side of 1 h, 24 h and 72 h; - ISO and epoch input; - null, empty and invalid timestamps; - a `healthThresholds` override through `/api/config/client`. One source guard remains: no age-vs-threshold comparison outside `roles.js`. - `tests/unit/test-my-repeaters-dashboard.js` now uses the real helper instead of a stub, which gave repeaters the node thresholds. It also checks that a repeater heard 30 h ago is Degraded. - New `tests/e2e/test-health-status-e2e.js` mocks `/api/nodes/<pk>/health` for six nodes. It checks five views: the favorites dropdown, the "My Nodes" card, the home health card, the analytics network status and the live node panel. It fails on `master` and on this PR's first commit. I put it on shard 2, which was the shortest shard in the last CI run. - Mutation check: I made 33 deliberate breaks. In the helper they cover each comparison and boundary. At each of the six call sites they cover the timestamp field, the role argument and at least one label mapping. Each one makes the suite fail. - I checked a `config.json` with `infraDegradedHours: 2` and `infraSilentHours: 6` in Chromium. Repeaters heard 3 h and 7 h ago show Degraded and Silent. - `sh test-all.sh` passes. It prints a `STALE ALLOWLIST` warning, which comes from a deliberate fixture in the a11y self-test. ### Cost The analytics network status loops over every node. In headless Chromium, 30,000 synthetic nodes take 9.0 to 9.2 ms before this change and 9.1 ms after (median of 21 runs, on one machine). ### Risk Low. The change is frontend only, with no API, config or data change. Rolling back means reverting the commits. --- 🤖 Generated with [Claude Code](https://claude.com/claude-code) --------- Co-authored-by: nullrouten <201262769+nullrouten0@users.noreply.github.com> Co-authored-by: Claude Sonnet 5.5 <noreply@anthropic.com> |
||
|
efitenandClaude Opus 5.5
|
927a8eec8a |
fix(nodes): node analytics rates cover the data in memory, and say so (#748) (#2211)
Refs #748 (M3a: correct numbers within the in-memory window; the SQL history in M3b is a separate plan, see the end). ## Problem The node analytics range picker offers 24h, 7d, 30d and All (365d), but the store only holds its in-memory window (`retentionHours`, then eviction). `GetNodeAnalytics` still divided availability and packets/day by the requested range. Measured on our live instance (14-day window), repeater BE-BRE-ON8AR: | Range | Availability | Packets/day | |---|---|---| | 7d | 88.7% | 91 | | 30d | 42.6% | 265 | | All | 3.5% | 22 | Nothing on the page said that the data stopped at the edge of the window. ## What changes - `coverageStart` returns the edge of the in-memory window: the latest of `oldestLoaded` (background-load progress), `now - retentionHours`, and a new `evictedThrough` that eviction sets to the newest `FirstSeen` it removed, so memory-pressure eviction inside the retention window moves the edge too. - `s.packets[0]` is not that edge, and the first version of this PR used it. Chunks are selected by `last_seen`, so a transmission first heard weeks ago and heard again recently sits at the head with its old `FirstSeen`. On staging (7-day window) it returned 21/07. - When the edge lies more than a minute after the requested start, node analytics counts only transmissions from the edge, computes availability and packets/day over that span, and returns `timeRange.dataFrom` and `timeRange.partial`. - The minute of slack keeps a range equal to the retention window from reading as partial. Without it every 7d request on staging (168h) was partial, because the two edges came from separate clock reads. - The analytics page shows "Data from 2026-10-07: the server keeps about 7 days of packets in memory. Availability and packets/day cover that period, not the full 365 days." when partial. - **UTC fix.** The window bounds of node analytics and node hop analytics are formatted in UTC. They are compared as strings with UTC `FirstSeen` values, so on a non-UTC host the 7d window lost its oldest hours (2 at +02:00). Docker images run in UTC, which is why this did not show in production. - `nodeTxsSince` (one caller) is inclusive, so a packet exactly on the edge is kept. ## Tests - Go, `node_analytics_coverage_test.go`: - full coverage within memory; - 30d over 3 days in memory; - empty store; - a re-heard 85-day-old transmission at the head of `s.packets` (edge stays at retention, packet not counted, no bucket before `dataFrom`); - memory-eviction edge; - eviction records `evictedThrough`; - retention 30 s shorter than the range is not partial, while 30d is; - window bounds under a +02:00 `time.Local`. - Two tests were checked to fail on the old code: the local-zone test (166 of 168 packets, a `+02:00` bound) and the retention test without the slack (`dataFrom 09:57:08` vs `from 09:56:38`). - Full `cmd/server` suite passes locally (skipping `TestSaveGeoFilterPreservesFileMode`, a Windows-only failure on clean master). One run of five reported `FAIL` and four reruns were green; I did not capture which test failed. - Frontend unit: `tests/unit/test-issue-748-node-analytics-coverage.js` (5 assertions on the real `node-analytics.js` in `vm`), in `test-all.sh`; the full suite passes. - E2E: `tests/e2e/test-issue-748-node-analytics-coverage-e2e.js` (registered in `deploy.yml` and `scripts/non-unit-tests.json`), against the real fixture response with no interception: 7d is not partial and shows no notice; All is partial and the notice names the real start date. 2/2 locally. ## Validation Staging (retentionHours 168), same repeater, after the background load completed: | Range | Before | After | |---|---|---| | 7d | 82.7% | 83.3%, not partial | | 30d | 19.3% | 83.3%, partial from 2026-10-07 | | All | 1.6% | 83.3%, partial from 2026-10-07 | In the browser the notice appears under All and not under 7d. ## Not done - M3b, older history from SQLite. In the database only the sender is indexed (`from_pubkey`). Recipients sit in `decoded_json`, and relay hops only in `observations.resolved_path` (filled for about 27% of observations on our live instance, not indexed). A fallback today would show only a node's own packets for older days, a different meaning than the in-memory part. Doing it properly needs a per-node index written by the ingestor (pubkey, transmission, role); that is a separate plan. - The other analytics endpoints with a range (observer analytics, RF) were not checked for the same dilution. --------- Co-authored-by: Claude Opus 5.5 <noreply@anthropic.com> |
||
|
efitenandClaude Opus 5.5
|
cab4f71c64 |
feat(nodes): LoRa radio settings per node from the MeshCore map (#1268) (#2209)
Fixes #1268. Frequency, spreading factor, bandwidth and coding rate are per-device settings that never travel in a packet. The public MeshCore map is the only source. This PR adds them to the node detail views, opt-in, and answers the open policy questions from the triage comments. ## Policy decisions | Question (triage) | Answer in this PR | |---|---| | Opt-out for self-hosted instances | Opt-**in**: `rfParams.nodesUrl` empty (default) = nothing fetched, `/api/rf-params` returns `enabled: false`. Same model as `knownChannelsUrl`. | | 33 MB every 6 h, thundering herd | Random 0-60 s delay before the first fetch, then every `refreshHours` (default 6). The map sends gzip (17 MB on the wire). It sends no ETag or Last-Modified, so conditional requests are not possible. | | Size cap | 128 MB on the decoded body (it is 51.5 MB today). Exceeding it fails the fetch instead of parsing a truncated body. | | Field shapes at the parse boundary | 64-hex key; 100-1100 MHz; SF 5-12; bandwidth from the LoRa set (7.8 to 500 kHz); CR 5-8. Invalid rows are dropped. A body that is not a well-formed array fails the fetch. | | Keep stale cache on anomaly | Any failure keeps the previous snapshot; a failed presets fetch keeps the previous presets. `fetched_at` is returned so an outage is visible rather than hidden. | | Freshness | Only adverts within `maxAgeDays` (default 7) are kept at fetch time and re-checked at serve time. | | TLS pinning | Not done: Go's certificate validation plus the field validation above. | ## What changes - `cmd/server/rf_params_cache.go`: stream decoder, validation, cap reader, preset parser (presets with identical values are merged, titles joined), background refresh. In memory only, no DB writes, so the read-only server invariant holds. - `GET /api/rf-params`: `{enabled, fetched_at, source, presets, nodes}`; `nodes` holds only nodes this instance knows, keyed by lower-case pubkey. `/api/nodes` is unchanged, so its payload does not grow for every consumer and the 500-row paging is unaffected. - Node detail (side panel and full page): `LoRa` row with the four values, the preset name when all four match one, and the age of the map advert. Shown only when the feature is on and the server has fetched the map at least once. - No column in the Nodes table, on purpose: on our network such a column showed one preset title in 814 of 1,366 rows and nothing in 443. Showing only the nodes that differ from their region is the follow-up PR. - `config.example.json` documents the block with the two URLs to use. ## Cost - Measured on the real map payload (51.5 MB, 66,336 nodes): parse 0.52 s, 15 MB allocated in total, 26,815 nodes kept (advert within 7 days). Runs in a background goroutine every 6 h. - The endpoint walks the cached node list once with map lookups: O(nodes). - Frontend: one bulk fetch of `/api/rf-params` when a node detail opens (client TTL 5 min), not one per node. ## Tests - Go (`rf_params_cache_test.go`): parse with every rejection reason, malformed bodies (not an array, truncated, wrong type, empty), preset merge and invalid presets, cap reader (one byte over refused, exactly at the cap accepted), fail-soft against an `httptest` upstream (503, HTML body, presets-only failure), config defaults, route (disabled shape, only known nodes, entry aged past max age dropped at serve time). Full `cmd/server` suite passes locally (skipping `TestSaveGeoFilterPreservesFileMode`, a Windows-only failure on clean master). - Frontend unit: `tests/unit/test-issue-1268-rf-params.js` (7 assertions on the real file in `vm`), in `test-all.sh`; the full suite passes. - E2E: `tests/e2e/test-issue-1268-rf-params-e2e.js` (registered in `deploy.yml` and `scripts/non-unit-tests.json`). It checks the real disabled state on the fixture server (no detail row), then serves `/api/rf-params` through `page.route`: no table column, full detail page with preset, side panel with raw values, and the hint for a node that is not on the map. 4/4 locally, plus the existing node table and node detail E2E files. ## Validation On a staging instance with `rfParams` set to the map and preset URLs: - Log: `[rf-params] 26821 nodes within max age, 20 presets`, about 6 s after start. - `/api/rf-params` returned 1,115 of our nodes: 988 on 869.618/SF8/BW62.5/CR8, 111 on the same with CR5, 15 on 433.65 MHz, 1 on SF7. - In the browser the detail row shows in the side panel and on the full page, and the Nodes table keeps its original columns. ## Not done - Highlighting nodes whose settings differ from their region's majority (a badge in the Nodes list plus a filter) is the follow-up (separate PR). In that follow-up a CR-only difference stays informational until it is confirmed whether MeshCore radios use the explicit LoRa header (then CR travels in the header and a mismatch still decodes). - `maxAgeDays` is config-only; the customizer is a later step. - No data is written to the DB, so the RF parameters are gone after a restart until the next fetch (at most 60 s plus the fetch time). --------- Co-authored-by: Claude Opus 5.5 <noreply@anthropic.com> |
||
|
efitenandClaude Opus 5.5
|
1ae4c74913 |
feat(observers): rolling 1 h TX airtime and a duty-cycle warning (#661) (#2208)
Fixes #661 (the narrowed scope from the 2026-10-14 comment). ## What changes - `GET /api/observers/metrics/summary` adds `tx_airtime_pct_1h` and `rx_airtime_pct_1h` per observer: the airtime share over the hour before now, whatever `window` is, from the cumulative `tx_air_secs` / `rx_air_secs` counters in `observer_metrics`. - A counter that goes down marks a reboot; only the stretch after the last reset counts. - Under 15 minutes of samples (one sample, or a reboot late in the hour) returns `null`. - Clamped to 0..100, rounded to 2 decimals. - The response also carries `duty_cycle_warn_pct`, from the new config key `dutyCycleWarnPct` (default 10, the EU 868 MHz g3 sub-band limit). Added to `config.example.json`. - RF Health tiles show `TX 1h: x%`; the observer list gets a sortable numeric `TX 1h` column. Both use the shared `public/observer-airtime.js` helper and flag values at or over the threshold with `.airtime-over` (`var(--status-red-text)`). - The handler now returns a named `MetricsSummaryResponse` struct instead of `map[string]interface{}` (one occurrence fewer). ## Why the warning matters Repeater and room-server firmware default to `airtime_factor = 1.0` (`examples/simple_repeater/MyMesh.cpp:890`), which `Dispatcher.cpp:26` turns into a 50% TX budget per 1 h window. The device therefore does not keep itself under the EU 10% limit; this view is where an operator can see it. ## Cost - Server: one extra query per summary request, `SELECT observer_id, timestamp, tx_air_secs, rx_air_secs FROM observer_metrics WHERE timestamp >= now-1h`, on the existing `idx_observer_metrics_timestamp`, then one O(rows) pass. On our instance that is 35 observers x about 12 samples (5 min interval). - Observer list: one extra bulk call `summary?window=1h` per load (client TTL 30 s, failure ignored), not a call per observer. ## Tests - Go: `TestRollingAirtimePct` (steady, reboot mid-hour, single sample, span under 15 min, reboot leaving under 15 min, nil counters, clamp, rounding), `TestGetMetricsSummaryAirtime1h` (samples older than 1 h ignored inside a 24 h window, single-sample observer gets null), `TestMetricsSummaryDutyCycleWarnPct` (default 10, config override, `observers` is `[]` not `null`). Full `cmd/server` suite passes locally (skipping `TestSaveGeoFilterPreservesFileMode`, which fails on Windows on clean master too). - Frontend unit: `tests/unit/test-issue-661-observer-airtime.js` (8 assertions, real file in `vm`), added to `test-all.sh`. `test-observers-headings.js` updated for the new column. Full `test-all.sh` passes locally. - E2E: `tests/e2e/test-issue-661-airtime-e2e.js`, registered in `deploy.yml` and `scripts/non-unit-tests.json`. The fixture DB has no `observer_metrics` table, so the summary is served through `page.route` with known values for the fixture's own observer ids. It checks the column header, over/under/unknown cells, sort order and the RF Health tile. 4/4 locally. It caught a real bug during development: `loadRFHealthData` declares a local `const window`, so the tile calls the helper as the global `ObserverAirtime`. ## Validation Deployed to a staging instance with live MQTT data (35 observers with metrics) and checked in the browser: - The observer list shows the column for 42 rows (33 with a value, 9 without enough samples). Sorting puts the highest share (5.3%) first. - RF Health shows `TX 1h` on all 35 tiles. With a fourth stat the line wrapped inside items on narrow tiles; the stats row now wraps between items only. - No observer was over 10% at the time, so the red state was checked by rendering one cell client-side at 12.5% (computed colour `rgb(185, 28, 28)` in light mode), and by the E2E test. ## Not done - The threshold is config-only; exposing it in the customizer is a follow-up. - No airtime comparison across observers (that is #671) and no per-packet airtime (Relay Airtime Share covers it). - Dark mode was not checked in the browser; `--status-red-text` is defined for both themes. --------- Co-authored-by: Claude Opus 5.5 <noreply@anthropic.com> |
||
|
efitenandClaude Opus 5.5
|
fbeb9e4d71 |
ci: frontend coverage from every E2E suite, merged across the shards (#2204)
Fixes #2203. ## Problem The frontend coverage badge (35.16% on run 38413268001) came from two sources on shard 2: one dump part-way through `test-e2e-playwright.js` and the `collect-frontend-coverage.js` tour. The other E2E suites run against the instrumented build but never save `window.__coverage__`, including the suites written for single pages (`path-inspector.js` 4.72%, `touch-gestures.js` 14% on that run). ## Change 1. `9d3bfad5` `test(e2e): red:` `tests/unit/test-e2e-coverage.js`, with fake pages, contexts and browsers (no Chromium needed). On the placeholder module the first assertion fails. 2. `c00bbb12` `feat(e2e):` the collector. - `scripts/e2e-coverage-hook.js` is a preload (`node --require`) that wraps `chromium.launch` from `playwright`. `playwright` re-exports `playwright-core`, so a suite's own `const { chromium } = require('playwright')` gets the same, wrapped object. - `scripts/e2e-coverage.js` reads `window.__coverage__` before every call that replaces or ends a page's document: `goto`, `reload`, `setContent`, `goBack`, `goForward`, `close`, and context and browser `close`. Pages from `newPage`, `newContext` and the context `page` event are all tracked. - Each read zeroes the page's counters, so a document read twice is not counted twice. Maps travel once per file; later reads carry counts only. - The page returns a JSON string. Returning the object cost about 10 s per suite, because Playwright serialises it node by node. - A read is given up after 5 s, so a busy page cannot hold up a suite's cleanup. - On exit the hook writes one file per suite to `.nyc_output/`, or nothing without coverage. A failed write is logged and never changes the exit code. 3. `64487c4c` `ci:` the workflow. - On master pushes the E2E run step sets `NODE_OPTIONS=--require ./scripts/e2e-coverage-hook.js`. On PRs it is empty, so PR runs are unchanged. - Each shard runs `nyc merge` (one file per suite is about 6 MB, mostly the same maps) and uploads `coverage-shard.json` with its results instead of `.badges/`. - The `e2e-test` job merges the three shards and makes the frontend badge (it used to come from shard 2 alone). - The merge, setup-node and badge steps are `continue-on-error`. When `nyc report` gives no statement percentage the step warns and writes no badge, so a registry hiccup cannot publish 0%. - `test-e2e-playwright.js` no longer writes its own `e2e-coverage.json`: the hook covers that suite completely, including the tests after the old dump. `collect-frontend-coverage.js` stays as an extra source. ## Performance Measured locally against an instrumented server (Windows, Chrome): | Suite | Without hook | With hook | |---|---|---| | `test-path-inspector-coverage-e2e.js` | 1.9 s | 2.2 s | | `test-touch-gestures-coverage-e2e.js` | 17 s | 16 s | | `test-e2e-playwright.js` (stops at the same local-fixture failure in both runs) | 52 s | 52 s | | `browser.close()` on a page in a 30 s busy loop | 153 ms | 5.2 s | The hook only loads on master pushes. ## Testing - `tests/unit/test-e2e-coverage.js` covers: - reads before each document-replacing call and before close; - pages opened by the page itself; - context and browser close; - summing without double counts; - a failed read, and a read that never answers; - the file writer, including a failing write. - Nine deliberate breaks of the library each turn it red: - dropping the counter reset; - dropping the `page` event, the `goto` read, the `goForward` read, the `close` read or the browser `close` read; - removing the timeout or the write guard, or writing an empty store. - The test also fails if it stops before its end. Without that check, a read that never returns would let node exit 0 half-way. - Real suites with the hook, measured on their own (the badge run had all suites): | File | Badge run 38413268001 | Own suite with the hook | |---|---|---| | `path-inspector.js` | 4.72% | 52.75% | | `touch-gestures.js` | 14% | 72.96% | - Exit codes and pass counts were unchanged with the hook for these suites (the first three were run before the 5 s read timeout was added): - `test-slideover-1056-e2e.js` (6 contexts); - `test-a11y-axe-1668.js` (`@axe-core/playwright`); - `test-issue-1150-404-state-e2e.js`; - the three above. - The badge step, run locally against two merged shard files: - It gives the same per-file numbers as `nyc report` on the inputs. - With no shard coverage, or with `nyc report` failing, it warns and writes no badge. - `sh test-all.sh` passes locally, apart from `test-issue-1956-release-routing.js`, which needs the workflow's `GITHUB_REF_NAME` and was skipped. The test inventory classifies 321 suites. `actionlint` 1.7.7 reports only the self-hosted runner label, as on master. **Not tested:** the shard and badge steps in CI. They only run on a master push, so the first master run after merge is the real test. I do not know what the merged number will be. I will compare the badge with the merged report in that run's `e2e-test` log. **Not counted:** a full page load the suite does not start through one of the wrapped calls, such as a link that leaves the SPA or `location.reload()` from page code. ## Not in this PR - The `tests/unit/` suites, which load frontend files through `vm.createContext` without instrumentation (noted in #2203). - Coverage on PR runs. The overhead above is small, so this could follow if wanted. --------- Co-authored-by: Claude Opus 5.5 <noreply@anthropic.com> |
||
|
Alex BandClaude Opus 5.5
|
352a0ccd19 |
feat(region-filter): configurable region quick picks (#2170)
## Summary **Independent of every other open PR.** Choosing a pick saves the selection, redraws the control and notifies the page's listeners itself, exactly as a click in the control does, so it re-queries straight away whether or not #2168 (`setSelected` notifies) is merged; with both in, nothing fires twice. Region quick picks are named groups of region (IATA) codes, offered as one-tap choices inside the region filter, e.g. "Northern California" for a dozen airport codes instead of ticking each box. One deployment has been injecting these into the page through an nginx `sub_filter` and a script that wraps `window.RegionFilter`; this makes them a configured feature. ```jsonc "regionQuickPicks": [ { "name": "Northern California", "description": "Bay Area and Sacramento observers.", "regions": ["SJC", "SFO", "OAK", "SMF"] } ] ``` - **Server:** `GET /api/config/region-quick-picks` returns the groups cleaned up: names and codes trimmed, codes upper-cased and de-duplicated in their configured order, groups without a name or codes dropped, at most 20 groups of 200 codes, always a list. `/api/config/regions` is unchanged. - **Region filter:** loads the groups with the regions and offers every group with at least one observer today, inside the region control: - dropdown layout: rows of the same kind as **All** (checkbox and bold name), directly under All with a divider before the single regions; the row is ticked while that pick is the selection, ticking it selects the pick and closes the menu, unticking goes back to all; - pill layout: the picks lead the same bar, set off from the single regions by a thin divider. - A tap selects the group's codes that have an observer and re-queries straight away. - The selector then reads the group's name ("South Bay ▾") instead of "2 Regions", and the button shows as pressed. Selecting the same codes by hand does the same. - Tapping the active group again goes back to all regions. - A failed fetch, or no configured groups, leaves the filter exactly as before. - **Mobile:** the rows take the menu's 44 px row height under `(pointer: coarse)`; the pill-bar picks reuse `.region-pill` and its touch target. Inside `.filter-bar` (Packets) the existing touch rule for inputs made every region checkbox a 44 px square; the checkbox is now 20 px and the 44 px row is the tap target. - **Semantics:** like every region filter, a group means "heard by observers in these regions", not "located there"; `config.example.json` says so. No existing issue covers this. ## Screenshot Nodes page with two picks configured (example config below), after tapping **South Bay**: the pick and its codes (SJC, MRY) are selected, and the list re-queried for them. Taken against `test-fixtures/e2e-fixture.db`. 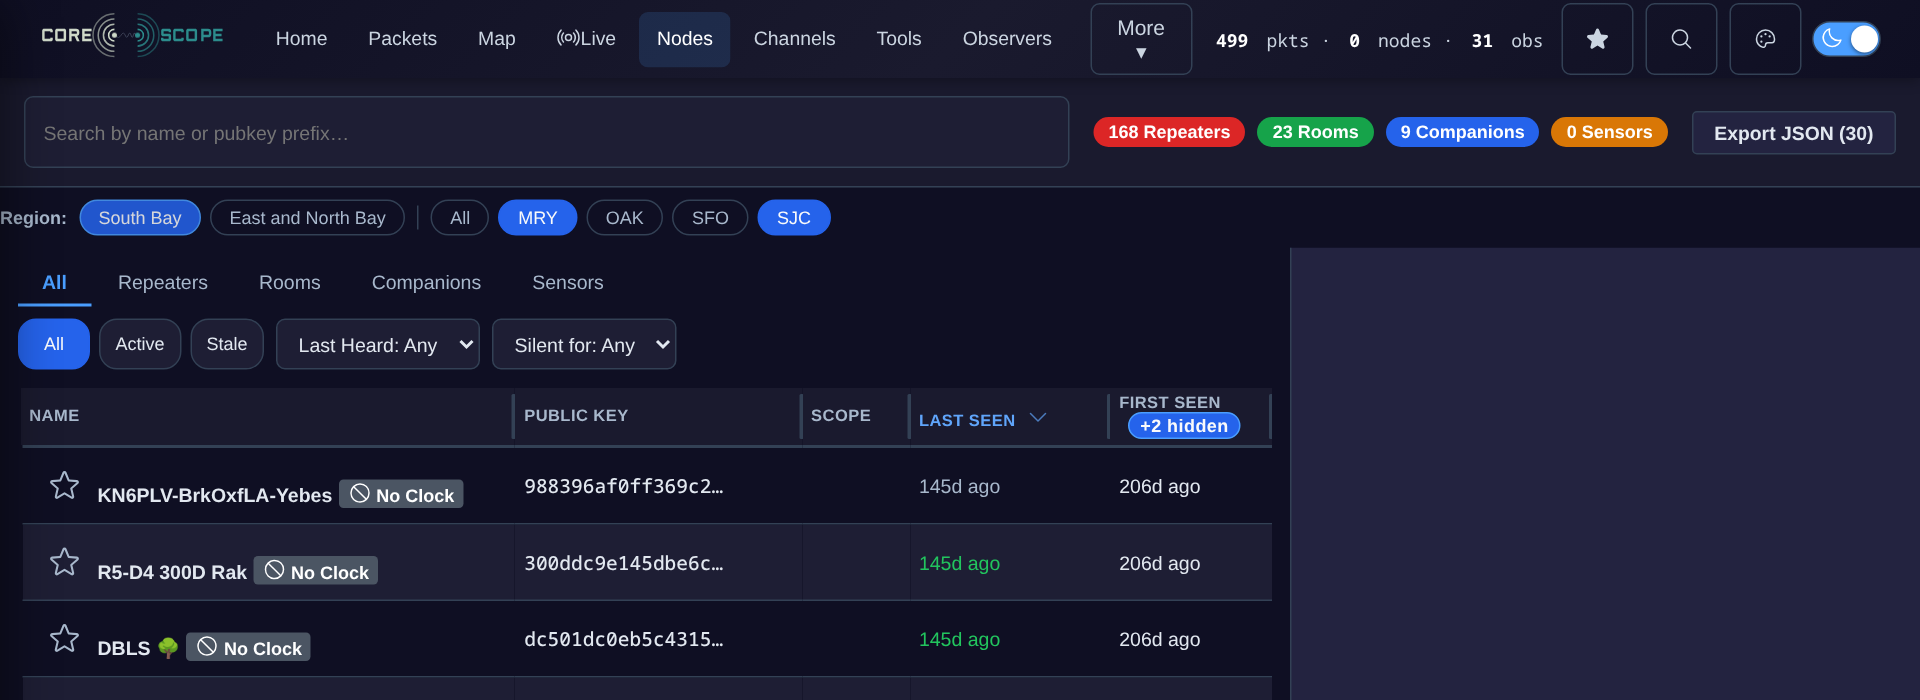 ## Config example ```json "regionQuickPicks": [ { "name": "South Bay", "description": "San Jose and Monterey observers", "regions": ["SJC", "MRY"] }, { "name": "East and North Bay", "description": "Oakland and San Francisco observers", "regions": ["OAK", "SFO"] } ] ``` Each pick needs a `name` and at least one code; `description` is optional (shown as the tooltip). Codes are trimmed, upper-cased and de-duplicated; a pick with no code that has an observer today is not shown. At most 20 picks of 200 codes. ## Browser validation The branch's server was run locally against a migrated copy of `test-fixtures/e2e-fixture.db` (observers in MRY, OAK, SFO, SJC) with three groups configured: "South Bay" (SJC, MRY, SCZ), "East and North Bay" (OAK, SFO, sts) and "Nowhere yet" (XXX). Checked in headless Chromium: | check | desktop 1280 px | phone 390 px (touch) | |---|---|---| | groups shown | South Bay, East and North Bay ("Nowhere yet" hidden) | same | | tap South Bay selects | SJC, MRY (SCZ has no observer) | same | | next `/api/packets` request | `region=SJC,MRY` | `region=SJC,MRY` | | selector label | "South Bay ▾" | "South Bay ▾" | | second tap | back to all regions | same | | button height | 24 px | 44 px | | page wider than viewport | no | no | | page errors | none | none | Checked on Packets (dropdown layout) and Nodes (pill layout). Three layout problems found this way on the phone were fixed before opening: a sideways-scrolling row clipped at the screen edge, the selector squeezed into a narrow column (the filter group is a non-wrapping flex row), and the two wrapped rows spread apart on Nodes (`align-content`). **Revision 1:** the first version put the picks in a separate row beside the selector; they moved inside the dropdown. Re-checked with a 14-region list and three picks on Packets: desktop 1280 px dark and phone 390 px light both keep the menu on screen (menu 340 px wide, page not wider than the viewport), the pick closes the menu and the trigger names the pick. **Revision 2:** picks are checkbox rows like **All** instead of chips. Re-checked on Packets at 1280 px dark and 390 px light: rows render bold under All, the divider separates the single regions, ticking a pick ticks its codes and names the trigger, no sideways scroll. Unrelated and not changed: on Nodes at 390 px the region row (existing pills included) starts flush with the screen edge. ## Tests - Red commit `81ea67d6`: the config type, a stub normaliser and endpoint returning nothing, and tests. - Go: cleaning (trim, upper-case, de-duplicate, drop incomplete groups), caps, nil config, and the endpoint's JSON. - Frontend, `tests/e2e/test-region-quick-picks.js` (moved from `tests/unit/` in `fced69a7`; it needs jsdom, so it runs in the E2E job like `test-table-sort.js`): the real `region-filter.js` in **jsdom** against faked config endpoints. Nine cases: rendering and hiding groups with no observer, selecting and re-querying, the selector label, toggling back, a hand-made selection marked active, the pill layout, no groups, a failed fetch, HTML escaping. Seven fail on the stub, all on assertions. - Green commit `0e33210e`: the implementation, styles, `config.example.json` (`regionQuickPicks` + `_comment_regionQuickPicks`), `docs/api-spec.md`, and the OpenAPI route list (`TestOpenAPICompleteness` requires it). The jsdom test also had a cross-realm comparison bug fixed in this commit (`Array.from` on arrays coming out of the jsdom window). - `make test`: 16 of 16 modules pass. Frontend suites: 195 of 196; the one failure, `test-issue-1956-release-routing.js`, needs CI's `GITHUB_REF_NAME` and fails the same way on `master` locally. - Red commit `f991060d` (revision): picks live inside the dropdown menu before the checkboxes, choosing one closes the menu, and in the pill layout they share the region bar; two fail on assertions against the old layout. Green commit `1f720e35`. Frontend 195 of 196 (same environment-only failure). - Red `134f5256` / green `da0adb50` (second revision): picks are checkbox rows between All and the single regions with a divider, no chips in the menu; ticking and unticking a pick row. The green commit also repairs `style.css`: `1f720e35` had prepended its block to the top of the file (its edit matched an earlier `.region-pill {`) and left the previous rules in place. The file now differs from `master` by 13 lines. ## Review notes - Groups are offered only when at least one of their codes appears in `/api/config/regions`, and only those codes are selected. The stored selection is pruned to known codes on load anyway, so selecting absent codes would not survive a reload. - Customizer (AGENTS.md rule 8): groups are operator configuration; a customizer editor could come later. ## SonarLint SonarQube Community rules (the SonarLint engine) were run on the files this PR touches, and only issues on lines it adds are listed. - **Fixed** in `b84ace4e`: - `normalizeQuickPickCodes` split out of the config normaliser (S3776, 17 > 15); - a comment on why a failed quick-pick fetch is ignored (S2486); - `for…of` in `activePick` (S4138); - in the tests: `node:` specifiers, `includes()`, and an explicit string comparator for sorted selections (S7772, S7765, S2871). - **Kept on purpose:** - S2486 is still reported on that `catch`. Swallowing the error is the intended behaviour: the filter works as before, just without picks. - S1523 on the `vm` test loader, as above. ## Checked against the repo rules - Rebased onto `master` (`673442cc`). Each red commit was re-run and still fails on its assertions; each green commit passes (TDD.md). - `make test`: all 16 modules pass. Frontend suites: all pass except `test-issue-1956-release-routing.js`, which needs CI's `GITHUB_REF_NAME` and fails the same way on `master` locally (#2160 addresses it). - No private data: test fixtures and examples use the codes the existing tests use (SJC/SFO/LAX, `#be`-style scopes). - No new `map[string]interface{}`, no hard-coded colours. `git add` was explicit, and there is one logical change per commit. 🤖 Generated with [Claude Code](https://claude.com/claude-code) https://claude.ai/code/session_01KaR4xu8gVykQBkH8yG8m6H --------- Co-authored-by: Claude Opus 5.5 <noreply@anthropic.com> |
||
|
efitenandClaude Opus 5.5
|
f3004d977e |
feat(rx-coverage): show where a companion drove and received nothing (#2172)
The Mobile RX coverage page (`#/rx-coverage`) shows only cells where a companion received something. Where a companion drove and received nothing is just as useful for operators, and the data is already there: the RF sample track (`client_rf_samples`, #1905/#1906) and the receptions (`client_receptions`) use the same hex grid (`hexCellAt`, `zoomToHexRes`). This PR adds those cells as a hatched layer under the reception cells. ## Changes in this PR **Server** - `GET /api/rx-coverage?...&gaps=1` adds a `gaps` member to the FeatureCollection: cells with moving (non-stationary) track samples and no reception in the same `days` window and `bbox`, each with `samples`. `gaps_truncated` is set when more than 5000 cells qualify (the most-sampled are kept, same pattern as `coverageFeatureCap` and `rfNoiseFeatureCap`). - Gaps are only returned when `clientRfSamples` is on and there is no `node` filter: with `?node=` the question would be "this node was not heard", which these cells do not answer. `?rx=` limits both the track and the receptions to that companion. - Without `gaps=1` the payload is unchanged: the `gaps` member is omitted. - New code lives in `cmd/server/rx_coverage_gaps.go` (pure `aggregateGaps` plus `queryTrackPoints`); the handler change in `rx_dashboard.go` is 14 lines. - `/api/rx-coverage` is now documented in `openapi.go` and removed from `openapi_known_gaps.json` (#1670). **Frontend** (`public/rx-coverage.js`, `public/node-reach-coverage.css`) - A "Nothing received" toggle on the signal layer, on by default, only rendered with `MC_CLIENT_RF_SAMPLES`. Hidden on the noise layer. - Gap cells use a 45-degree hatch (an SVG pattern in a dedicated renderer, so they sit under the reception cells). The hatch is denser for cells driven through more often (1 / 2-3 / 4+ samples). Tooltip: sample count. Legend entry: "driven, nothing received". - Off state is deep-linkable as `gaps=0`. - New token `--nq-cov-gap` for light and dark. Plain grey (`--nq-cov-grey`) already means "received, no SNR", so the hatch keeps the two apart. ## Threshold: one sample Measured on a live network (analyzer.on8ar.eu, Belgium, September to October 2026), with cells of about 250 m: a cell with track samples and no reception in one half of a month, driven again in the other half. How often did it receive something the second time? | Minimum samples | Cells "nothing received" | Driven again | Received something later | |---|---|---|---| | 1 | 3971 | 1263 | 29% | | 2 | 1565 | 592 | 32% | | 3 | 619 | 243 | 35% | | 5 | 142 | 63 | 40% | A higher threshold hides cells without making the rest more reliable, so the threshold is 1 and the wording is "nothing received in this period", never "no coverage". Using every decoded packet as reception evidence (including 1-byte path hashes) gave 25% to 32%, so the capture rule for 1-byte hashes is not what drives this. The median cell has 2 samples. ## Verification - Go: 7 new tests in `rx_coverage_gaps_test.go` (gap/no gap, stationary excluded, single sample, cap keeps the most-sampled, endpoint, `?rx=` filter, no `gaps` member when not asked / with `?node=` / with RF samples off). The endpoint tests fail without the handler change. Full `cmd/server` suite green locally, `go vet` and `gofmt` clean. - E2E: `tests/e2e/test-rx-coverage-gaps-e2e.js` (4 steps: no toggle with RF samples off, on by default with hatched cells under the reception cells, toggle off with `gaps=0` and deep link, noise layer hides it). 2 steps fail without the frontend change. Existing `test-rx-coverage-noise-e2e.js` and `test-rx-coverage-viewport-e2e.js` still pass. Listed in `scripts/non-unit-tests.json`. - Frontend unit suite (`test-all.sh`) green. - Real data on a staging instance (7 days, bbox 50.8,4.9,51.3,5.8, z=12): 478 reception cells and 379 gap cells, no cell in both, reception features identical with and without `gaps=1`, 0.48 s to 0.52 s per request both ways. - Browser: checked on staging with real data (light theme), and light, dark and 390 px wide with mocked data. ## Not in this PR - A per-node variant on the Reach page ("this repeater transmitted while a companion was nearby, and was not heard"). That needs the transmit moments from `observations` and is a heavier query. - `deploy.yml` does not get a line for the new E2E file, like the other entries that are only in `non-unit-tests.json` (#2037). Co-authored-by: Claude Opus 5.5 <noreply@anthropic.com> |
||
|
efitenandClaude Opus 5.5
|
d232072f85 |
feat: optional user accounts (part A: foundation) (#2129)
Part A of #2128: optional, off-by-default user accounts. With the feature off nothing changes; with it on, visitors can register and log in, and admins manage users and use the operator actions without the API key. PR #2130 (settings sync) builds on this one. The two are meant to be merged together. ## The situation - Operator actions (geofilter save and prune, backup, perf reset) need the shared `apiKey`. There is no per-person right. - Nothing in CoreScope knows who a visitor is, so the requests in #2128 that need that (#1835, #2092, #1508, #730) have nothing to build on. ## What this PR adds **Two new Go modules** - `internal/users`: a separate `users.db` (SQLite through `modernc.org/sqlite`) with users, sessions, single-use tokens, an audit log and a mail log. Passwords use argon2id. - `internal/mailer`: a `Mailer` interface with a Brevo client (send, delivery events, webhook parsing) and an in-memory fake for tests. **Server (`cmd/server`)**, active only with `userManagement.enabled` - 24 routes, all documented in OpenAPI under the `users` tag ([`auth_routes.go`](https://github.com/efiten/CoreScope/blob/feat/user-management/cmd/server/auth_routes.go)): - auth: register, activate, login, logout, me, forgot, reset; - account: profile, password, email change with confirmation, sessions, self-delete; - admin: list, detail, disable, enable, delete, role, resend activation, manual activation, mail status refresh; - a Brevo webhook, registered only when `mail.webhookSecret` is set. - `requireAdmin` replaces `requireAPIKey` at the 7 operator call sites: the API key **or** an admin session. With the feature off it is the old API-key gate (`TestRequireAdminWithoutUserManagementIsAPIKeyGate`). - `/api/config/client` gets `userManagement: {enabled: true}` only when the service started; with the feature off the response is byte-identical. **Frontend** - `auth.js` (header account control, request helper that adds the CSRF header), `account.js` (login, register, activate, forgot, reset, confirm email, my account), `admin-users.js` (`#/admin/users`, deep-linked filters), `account.css` (theme tokens only). - On phones the top-bar control is hidden, so a conditional entry goes into the bottom-nav "More" sheet and the nav drawer. - The customizer geofilter tab and the Perf "Reset stats" button use the admin session when there is one. **Config.** A `userManagement` block (`config.example.json`, [`docs/user-guide/accounts.md`](https://github.com/efiten/CoreScope/blob/feat/user-management/docs/user-guide/accounts.md)). The Brevo key can come from `CORESCOPE_BREVO_API_KEY`. The server refuses to start when the block is enabled but incomplete. ## Security choices - Session cookie `cs_session`: HttpOnly, SameSite=Lax, Secure when `publicBaseUrl` is https. Every cookie-authenticated state change needs the `X-CS-CSRF` header and a matching Origin. - Activation needs the token **and** the account password. Without the password, an attacker who keeps re-registering a known address could get the owner to activate an account that carries the attacker's password. - Register, forgot and email change answer identically for known and unknown addresses. A password reset ends all sessions, a password change ends all other sessions, and both end outstanding email-change links. - Rate limits: login 10 per 15 minutes, register and forgot 5 per hour, per IP and per address. The bucket count is capped. `trustedProxies` makes the per-IP limits see real client IPs behind a proxy. - Server logs carry `#<user id>`, never addresses, tokens or passwords; mail-provider error texts are redacted before logging. ## Performance No change to an existing hot path with the feature off. With it on: - One `users.db` lookup per authenticated request (session by token hash). - The admin user table rebuilds its `tbody` on each filter change. `users.List` caps the result at 1000 rows (`internal/users/users.go`), which bounds the rebuild. - `map[string]interface{}` in `openapi.go`: 79 before, 78 after. ## Verification - `internal/users`, `internal/mailer` and `cmd/server`: `go vet` and `go test -race` pass locally. 121 new Go tests. - `cmd/server` with `-tags e2etest`: vet and the e2e hook tests pass. - `sh test-all.sh` exits 0. `tests/unit/test-user-management-ui.js`: 67 passing (vm, real modules). - `tests/e2e/test-user-management-e2e.js` (6 steps) passed locally against an `e2etest` build with the fake mailer and against a feature-off build. CI builds the `e2etest` binary and runs the suite on a second server (`deploy.yml`). - On a staging instance with a real Brevo key: register, activation mail delivered, activate, admin table, "Refresh status" showing sent, deferred, delivered, opened and clicked. ## Not in this PR - Settings sync (#2130), the admin dashboard, approval flows and notifications (parts B to E of #2128). - A `requireReadAuth` mode (#1835). Sessions from this PR are what such a mode would accept. - Binary size and build time with `modernc.org/sqlite` linked next to `mattn/go-sqlite3` were not measured. Their driver names do not collide. #1992 discusses the driver choice. - No Brevo webhook was configured on staging; delivery status there came from "Refresh status". --------- Co-authored-by: Claude Opus 5.5 (1M context) <noreply@anthropic.com> |
||
|
efitenandClaude Opus 5.5
|
000d9ab030 |
feat(coverage): RF noise-floor layer on the Mobile RX coverage page (#2113)
The ingestor already stores the noise floor that CoreDrive RX companions
report with each GPS fix (`client_rf_samples`, opt-in through
`clientRfSamples`, `cmd/ingestor/client_rf_sample.go:62`), but nothing
reads it back. An operator who enables it collects the data and cannot
see it. This adds the read side: `GET /api/rf-noise` and a Signal/Noise
toggle on the Mobile RX coverage page.

## What it does

- **`GET /api/rf-noise?bbox=&z=&days=`** returns a GeoJSON hex grid with
the median, quietest and noisiest noise floor per cell, in the same
shape as `/api/rx-coverage`. It is registered always and 404s unless
`clientRfSamples.enabled` is true, the same pattern as the coverage
routes.
- **Stationary samples are excluded.** A parked companion logs hundreds
of readings at one point, which would otherwise define its cell.
- **Coverage page:** a Signal/Noise toggle, rendered only when
`/api/config/client` reports `clientRfSamples: true`. The noise layer
reuses the coverage colour tokens with the axis inverted, because a
lower dBm is quieter. Tiers are at -115 and -108 dBm.
- **Deep link:** `#/rx-coverage?layer=noise` opens on the noise layer.
- **Empty and failed answers** are labelled on the map ("No RF samples
in this view yet", or a retry hint), so a blank map never reads as
"feature off".

No new configuration key: it reads the existing `clientRfSamples`
section that the ingestor already uses. Default off, so nothing changes
for an instance that has not opted in.

## Where it comes from

Ported from the efiten/CoreScope fork, where it has run on
analyzer.on8ar.eu since September (fork commits `42d09f0e`, `80581c43`,
`cde95078`). The cherry-picks conflicted with upstream's newer
`routes.go`, `types.go` and `rx-coverage.js`, so the final state was
ported by hand. The fork-only `/scopes` route that sat next to it in the
same hunk is deliberately left out.

## Performance

The query is bounded by `sampled_at` (indexed, `idx_crf_prune`) and the
bbox, aggregation is one pass plus a per-cell sort, and the response is
capped at 5000 cells. Measured on analyzer.on8ar.eu, all of Belgium
(`bbox=49.4,2.4,51.6,6.5&z=9`), from a client in Belgium, so network
time included:

| window | samples | cells | response time |
|---|---|---|---|
| 7 days | 10,835 | 241 | 0.37 s |
| 30 days | 43,303 | 429 | 0.39 s |

That table holds 45,270 rows in total. It is only read when someone
opens the noise layer, never on ingest or WebSocket paths.

## Tests

- `cmd/server/rf_noise_test.go`: 8 tests for the aggregation (median and
extremes, stationary exclusion, the cell cap, empty input) and the gate
(404 when off, even with data present). All pass, and the full
`cmd/server` suite passes locally.
- `tests/unit/test-rx-coverage-noise.js` (new, in `test-all.sh`): the
colour axis runs the right way, including both tier bounds and a string
median from the API. Slices the real function out of `rx-coverage.js`
and fails on master's copy, which has no thresholds.
- `tests/e2e/test-rx-coverage-noise-e2e.js` (new, wired in `deploy.yml`
and `scripts/non-unit-tests.json`): no toggle when the flag is off;
Noise fetches `/api/rf-noise`, draws the cells, swaps legend and
subtitle, puts `layer=noise` in the hash; a deep link opens on the noise
layer and an empty answer shows the message. 3/3 locally; against
master's `rx-coverage.js` and `roles.js`, 1/3 (only the "flag off" case
passes, as it should).
- `test-rx-coverage-viewport-e2e.js` still passes. ESLint 8 reports 0
errors on the changed files.

## Not done

- The thresholds (-115 / -108 dBm) are fitted to the fork's own data
(1,241 moving samples at the time) and are constants in
`rx-coverage.js`. Per AGENTS.md rule 8 they belong in the customizer
eventually; not in this PR.
- The E2E suite mocks the API. The real endpoint is covered by the Go
tests and by the measurements above, not by a fixture with seeded
samples.

Co-authored-by: Claude Opus 5.5 <noreply@anthropic.com>
|
||
|
Sylvain Rabot
|
a4a447acea |
fix(packets): pack short columns, one expand arrow, Full Names toggle (#2090)
The packets table wastes most of its width on short columns, draws two arrows on grouped rows, and cuts every observer and hop name short. This fixes all three and adds a way to read the full path when it does not fit. ## Why the columns were wide `makeColumnsResizable` measured each column once on load and stored the widths as **percentages** of the table. Percentages grow with the screen: on a 2000px display "17s ago" sat in a 180px column. The measurement also read the virtual-scroll spacer row — a single `colspan` cell as wide as the table — as column 0, so the expand column came out 160px wide locally and about 950px on a live instance with grouped rows. Measured on the fixture at 2000px: | Column | Before | After | |---|---|---| | Expand | 162–230px | 32px | | Time | 111px | 67px | | Size | 64px | 46px | | HB | 44px | 29px | | Scope | 80px | 48px | | Path / Details | ~180px each | ~650px each | ## The change **Column packing.** A new `fitColumnsToContent` (`app.js`) sizes every column except Path and Details to its widest cell, in px; those two split what is left. Every visible column gets an explicit width and the table gets their sum: a spacer row keeps a slot for each hidden column, and leaving any column `auto` hands those slots a share of the slack as a blank strip at the right edge. When space is short (detail panel open, narrow window) the widest fixed columns give way first, then Path and Details shrink to 60px, and only then does the wrapper scroll. The split itself is a pure function, `distributeColumnWidths`, with unit tests. It re-lays out when the container resizes (detail panel), when TableResponsive hides or reveals columns (a new `table-columns-changed` event), and after sorting or a column toggle. After each render `grow()` widens columns for the rows just inserted and never narrows them, so nothing jitters while scrolling. Drag handles store px; double-clicking one resets it. Path and Details have no handle. `makeColumnsResizable`, still used by the nodes, observers and analytics tables, now skips `colspan` rows when measuring; other rows are measured as before. **One expand arrow.** A CSS `::before` "▶" sat next to the SVG caret, which pointed up when collapsed. The glyph is gone and the caret points right, then down. **Full Names.** A toolbar toggle next to Hex Paths shows observer and hop names untruncated. It is saved per browser; a link can carry `fullNames=1`, which applies to that page without overwriting the visitor's saved preference. Paths stay on one line: the virtual scroller positions rows at one fixed height, so wrapping would make scrolling jump. **The "+N" path pill, and a full-path popover.** Hops past the column edge were meant to go behind a "+N" pill (#1124), but the pill was appended after the overflowing chips and so sat past the clipped edge: it never showed. It is now sticky at the right edge, opaque on hover, and counts hop chips only (it used to count warning icons too). Hovering or focusing it shows the full path, one hop per line and numbered; click, Enter or Space pins it until an outside click or Escape, and it closes when the page changes or its row scrolls away. Clicking the pill no longer selects the row underneath. **Two related fixes.** - Rows drawn before `/api/observers` resolves show raw 64-char pubkeys. `loadObservers` now re-renders and re-measures, instead of leaving Observer at the pubkey's width (~600px under Full Names). - Group child rows indented every cell by 20px, which misaligned them with the headers and widened every column on expand. Only the Time cell is indented now. Anyone who had dragged packet columns gets the new defaults once: the old percentage key is dropped. ## Performance `grow()` runs after every `renderVisibleRows`, so it is on the hot path. Measured in Chromium on the fixture, 300 iterations, three runs: | Case | Cost | |---|---| | Full render, 63 rows measured | +0.88–0.93ms over the forced reflow alone | | Scroll step (incremental render) | ~73 `Range` rect reads, only the inserted rows | | Large jump / re-render | ~569 rect reads | Before narrowing `grow()` to inserted rows, one scroll step with 92 rendered rows made 5,472 rect reads. The DOM row count is bounded by the virtual-scroll window, so the cost does not grow with the packet count. `distributeColumnWidths` is a binary search over at most ~10 columns. ## Tests - `tests/e2e/test-packets-compact-columns-e2e.js`, 16 cases: short columns stay under fixed px bounds at 1920px; Path and Details take the freed width; hiding both still fills the wrapper; no blank strip and no horizontal scroll, with and without the detail panel, at 1920, 1100, 1000 and 375px; responsive reveal and re-hide refit; stale percentage widths dropped; drag follows the pointer and double-click resets; expanding a group leaves widths alone; Full Names untruncates, keeps paths on one line, persists and round-trips through the URL; the Observer column shrinks back when observer names arrive late; the pill popover lists every hop vertically, closes when the pointer leaves, pins on click without selecting the row, closes on Escape and on navigation, and opens on keyboard focus. Registered in `scripts/non-unit-tests.json` and `deploy.yml`. - On `master` the suite fails where it should, and restoring each fix's old behaviour (child-row indent, the late-observer refit) turns its case red. - `tests/unit/test-packets.js`: `distributeColumnWidths` (room to spare, rounding, widest-first capping, floors, dragged columns, the 60px minimum, overflow), the single chevron and no `::before` glyph, Full Names on flat and grouped observer cells, and the Full Names CSS. - `tests/unit/test-xss-escape-sinks.js` now builds the real `obsCellName` from source: escaping moved into it. Removing its `escapeHtml` turns both observer-cell tests red. - `test-issue-1189-composed-cell.js` and `test-issue-2012-clear-filters-selection.js` evaluate packets.js fragments with injected helpers and needed `obsCellName` / `showFullNames` added. - Existing packets E2E suites pass on this branch and on master against a CI-prepared fixture: scope column, #1128 (layout and multi-viewport), #1122, #1188, #1648, table sort, #1692, #1486. - Unit: 182 of 183 suites pass locally; `test-issue-1956-release-routing.js` could not create a temp directory in my sandbox and is unrelated. ## Browser validation Checked in Chromium against the fixture at 2000, 1920, 1280 (panel open and closed), 1100 and 375px, and with the seeded grouped row expanded and collapsed. Screenshots taken at each step; the table fills its container exactly, grouped rows show one arrow, and the pill popover lists full names. ## Not done, deliberately - **No width cap on Observer under Full Names.** A cap brings back the truncation the toggle removes, and Observer is already the first column to give way when space is short. - **Customizer.** The floors (60px flex minimum, 64px shrink floor, 32px expand, 58px Rpt) are hardcoded, per AGENTS rule 8; exposing them in the customizer can follow. - **Wrapping paths.** Rejected because of the fixed row height above; the pill popover is the way to read a long path. |
||
|
efitenandClaude Opus 5
|
25f8426d32 |
test: make every suite in tests/e2e run, and tell the truth when it does (#2053)
Closes #2037. Step 1 (#2045) wired in the nine suites that already passed. This is steps 2 and 3: the four that ran and failed, and the five that could not run at all. After this, the count of suites in `tests/e2e` invoked by nothing goes from 18 to 0. ## Step 2 — the four that ran and failed Triaged against a fixture server in CI with full output kept, not the four-line tail the first probe saved. | suite | verdict | |---|---| | `test-packets-scope-column.js` | passes on master today. It failed on 2026-09-18, so something between the two fixed it. Wired in unchanged rather than investigated. | | `test-node-reach-e2e.js` | test wrong. It waited for the reach map whenever any *link* had GPS; `public/node-reach.js` builds the map only when the *node* has coordinates. Guaranteed 10s timeout on a node with positioned neighbours and no position of its own. | | `test-channel-modal-e2e.js` | both failures test-side. The Add button's visible label was shortened to "+ Add" with the accessible name moved to `aria-label` (`public/channels.js:746`); and `.ch-section-mychannels` is conditional on the visitor having added a channel, which has not happened at that point in the suite. | | `test-touch-targets.js` | three test-side, two a product finding. | The three test-side touch-target failures were the harness measuring controls that are not shown: `.compare-btn` (the CTA was removed in #1646, and `style.css` says so), `.ch-back-btn` (`display:none` outside the mobile channels layout), and `.filter-toggle-btn` (`display:none` on mobile since #1461; the control shown is the navbar mirror, which `mobile-page-actions.js:70` builds as a `.nav-btn`, so it was already measured). All three are dropped from the table with the reason recorded in the file. The remaining two are **not** a test problem: `.nav-btn` and `.ch-icon-btn` are each declared twice in `public/style.css`, 48px in the touch-target block and 44px in their own component rule, and the later one wins. Rather than lower the blanket or hide the failures, the suite now has `DEFAULT_MIN = 48` plus a `MIN_OVERRIDES` table holding those two at their effective 44, so a third selector dropping to 44 still fails the build. The contradiction is **#2052**, with both ways out costed; the override entries should go when it is settled. ## Step 3 — the five that could not run None is deleted. I checked each selector and seam against the product before deciding, and every one still targets a surface that exists and that nothing else covers. Four were written against `@playwright/test`, a runner the project neither installs nor uses anywhere else. Adopting a second runner for twelve tests costs more than porting them, and the precedent is already set: `test-path-inspector-coverage-e2e.js` exists, as its own header says, because `test-path-inspector-e2e.js` could not run. So they are ported to the plain-node Chromium pattern the other 109 suites use. - **`test-issue-1522-trace-url-sync-e2e.js`** — the trace hash in the URL, both directions. `test-e2e-playwright.js` covers that the page loads and searches; it never looks at the URL, which is the whole of #1522. - **`test-marker-outline-weight.js`** — the canvas pulse ring never thins below 2px. There is no CSS rule to read and axe cannot see inside a canvas, so sampling the seam is the only way. Added a guard that the ring was actually visible, so the weight check cannot pass vacuously on a pulse that never rendered. - **`test-pr-1490-live-map-gpu-animations-e2e.js`** — the queue drains, the engine sleeps again, the fading trails stay under the cap of 5, and the canvas sits on `animationsPane` rather than under the markers. - **`test-path-inspector-e2e.js`** — reduced to what nothing else covers: the map side pane, the `/#/traces/<hash>` redirect, the tools landing. Its standalone-page test duplicated the wired coverage suite and is dropped. Its "switching candidate clears prior polyline" case ended after the click with a comment and no assertion, which is the same green-but-empty problem this issue is about; it now compares path counts, and skips loudly when the fixture yields too few candidates. The fifth, **`test-table-sort.js`**, needed `jsdom`, which was declared nowhere. It is a unit test of `public/table-sort.js` filed under `tests/e2e`, so: `jsdom` is a devDependency (lockfile updated, `npm ci` stays consistent), the file moved to `tests/unit/`, and the `domIntegration` group in `scripts/non-unit-tests.json` is gone with its only member. It runs 22 tests. 20 passed immediately; 2 had rotted, because #1648 M2 replaced the up/down glyphs with Phosphor sprites and the direction moved out of `textContent` into the `<use href>`. Those two now read the sprite ref and the `aria-sort` value, so they also guard the accessible announcement. ## Verification `tests/unit/test-table-sort.js` 22/22 and `test-test-inventory.js` pass locally; the E2E suites need a fixture server, which I cannot build here (no cgo toolchain since #1992), so CI is their first run as committed. The triage above was measured in CI, not assumed. ## Not done The per-assertion skips named in the second comment on #2037 are untouched: the two flaky packet-detail cases, the fixture-data ones, and the two `clientRxCoverage` suites that skip wholesale while reporting success. Those need a fixture deployment with coverage enabled, which is its own change. I have not opened it. Option 2 from the issue, making `test-test-inventory.js` require a `deploy.yml` line for every `tests/e2e` file, is also not here. It is the right guard and it is now enforceable, since the list is finally at zero, but it belongs in its own change where a red build means what it says. --------- Co-authored-by: Claude Opus 5 (1M context) <noreply@anthropic.com> |
||
|
efitenandClaude Opus 5
|
5c016a210a |
fix(analytics): show a building state on the distance index's 202, and stop caching it (#2051)
Closes #1997. ## What was wrong `/api/analytics/distance` answers `202 {status:"building", retry_after_seconds:5}` with no `summary` until the lazy index (#1011) has been built. 1. `renderDistanceTab` read `data.summary.totalHops` straight away. The TypeError is caught by the tab's own try/catch, so it never reaches `window.onerror`: it is painted into the tab as `Failed to load distance analytics: Cannot read properties of undefined (reading 'totalHops')`. 2. `api()` caches any `res.ok` body, and `res.ok` is true for 202, so the placeholder was stored for the `analyticsRF` TTL. Even a correct retry read the cached "building" body back. That is the half that made the broken state outlast the index build. ## What changed - `public/app.js:173` skips the cache write when `res.status === 202`. A 200 still caches, unchanged. - `public/analytics.js` renders a building notice and retries itself, honouring `retry_after_seconds` clamped to [1s, 30s]. The timer is cleared on tab switch and in `destroy()`, and a new render supersedes a pending retry, so two renders cannot write into the same tab. The notice uses `.text-center`/`.text-muted` rather than the `.spinner` class used at `analytics.js:1683`, because `.spinner` has no CSS anywhere in the repo and renders nothing. ## Tests `tests/unit/test-issue-1997-distance-building.js` (7 assertions, wired into `test-all.sh`) pins the two pure decisions the renderer makes and `api()`'s refusal to cache a 202 while still caching a 200. Red-run on the unfixed sources: 6 of 7 fail, and the "a 200 is still cached" control stays green. `tests/e2e/test-issue-1997-distance-building-e2e.js` (classified in `scripts/non-unit-tests.json`, invoked from `deploy.yml` with `CHROMIUM_REQUIRE=1`) serves both responses by route interception, so it does not depend on whether the server under test has an index built. It asserts: the building state appears, the tab does not paint the error text, a retry arrives with no interaction, the retry replaces the placeholder once the server answers 200, and no retry fires after leaving the tab. Check (2) deliberately asserts on the rendered text and not on `pageerror`: the TypeError is caught, so a `pageerror` assertion would pass on the broken build too. ## Verification No local cgo toolchain here since #1992, so I could not build a server to run the E2E against. Instead I ran its five steps in Playwright against a live instance with this branch's `public/app.js` and `public/analytics.js` injected in place of the deployed ones (both files are byte-identical between that instance and upstream master, so the injection is faithful): | check | deployed build | this branch | |---|---|---| | (1) building state shown | fail | pass | | (2) not rendered as data | fail | pass | | (3) retried on its own | fail (1 request) | pass (2 requests) | | (4) real payload after retry | fail | pass | | (5) no retry after leaving the tab | pass | pass | (5) passes on the broken build too: it schedules no retry at all, so it is a control and only means anything together with (3). The committed E2E suite has not been run as committed. CI is its first real run. ## Not done - The server still recomputes on every 202 poll rather than signalling readiness. - No other analytics tab was audited for the same assume-a-summary pattern. - One pre-existing unit suite (`test-preflight-xss-gate.js`) fails on this Windows machine with a cp1252 `UnicodeEncodeError` from its Python helper, on a clean tree as well as with this change. Unrelated, and green on Linux CI. Co-authored-by: Claude Opus 5 (1M context) <noreply@anthropic.com> |
||
|
liquidraver
|
84eba41592 |
fix(live): anchor the legend toggle to .live-page so the VCR bar stops eating its clicks (#2049)
The PACKET TYPES legend could not be dismissed on Live: clicking the palette toggle did nothing, while document.querySelector('#legendToggleBtn').click() from the console worked. That asymmetry was the diagnosis, since a synthesised click skips hit testing.

Residual half of #1833. That fix corrected the button's offset to calc(var(--vcr-bar-height) + 10px) but left the anchor: .legend-toggle-btn was position: fixed, so the offset resolved against the viewport, while the .vcr-bar it clears is absolute inside .live-page, whose height subtracts --bottom-nav-reserve (56px + safe-area at <=768). The two anchors disagreed by exactly the reserve, dropping the button into the bar's band, and .vcr-bar at z-index 1000 against the button's 500 took every real click. The window is 641-768px: below 641 both buttons are display:none, above 768 the reserve is 0, which is why neither the desktop nor the phone layout test saw it.

Both buttons are now position: absolute, resolving against the same containing block as the bar. .feed-show-btn carried the identical defect but missed the bar by 16px because --legend-toggle-stack parks it a row higher, so that change prevents a break rather than repairs one.

Three review rounds, each verified rather than argued:
- The new E2E was classified in non-unit-tests.json but had no deploy.yml line, so it would never have run (#2037). Now wired in, and it covers both buttons.
- The '.feed-show-btn is display:none at <=768' claim was wrong (it is <=640), which the author measured and corrected.
- Its first real execution failed on its own setup: getComputedStyle().getPropertyValue() on an unregistered custom property returns the unevaluated declaration ('calc(56px + 0px)'), so the non-zero check could not work. It now asserts the measured gap instead, and deliberately does not pin 56 because the gap measures 58 on CI.

Final run: 14 passed, 0 failed. The discriminating assertion is (f), each button's offset net of the bar being identical at 720 and 1440 (11px and 123px slack); under the old anchor those differ by the reserve. (g) pins the desktop layout unmoved.

Merged by the interim maintainer without a second human reviewer: CI and the review above are the independent checks.

Fixes #1833
|
||
|
liquidraver
|
bbf54cfe1b |
fix(rx-coverage): open at the configured map default, with its own saved viewport (#2033)
The coverage page opened at a hardcoded [51.0, 4.8] zoom 8 regardless of deployment, ignoring /api/config/map (#2032). It now follows the same precedence as the main map (URL hash, then saved position, then /api/config/map, then [37.6, -122.1] zoom 9) and persists its own position across visits, syncing lat/lon/zoom into the hash so a view is shareable. The saved position lives under its own key, rx-coverage-view, and the page never reads or writes the main map's map-view: sharing the configured default was the bug, sharing the session position was not. Both suites assert map-view stays untouched after a pan, so reintroducing a shared write fails instead of passing quietly. Also fixed here: selectedRx is now percent-encoded into the hash, and a generation counter stops a late /api/config/map response or a stale 150ms layout timer from building a map for a page that was already left. Reviewed twice. Verified by mutation rather than by reading: writing map-view too, ignoring the saved coverage position, and dropping the /api/config/map fetch each make the unit suite exit 1, so it covers the feature, the fix and the rejected alternative. The deploy.yml invocation was confirmed to land inside Run Playwright E2E tests (fail-fast) by parsing the workflow, and CI run 35261689694 is the E2E suite's first real execution: Go prints 'RX coverage viewport regressions OK' and Playwright prints 'RX coverage viewport browser regressions OK'. Worth recording for the next reviewer: that E2E asserted localStorage.getItem('map-view'), so wiring it into deploy.yml without updating the assertion would have turned the job red on its first ever run. It was registered in scripts/non-unit-tests.json but invoked by nothing, the gap tracked as #2037. Merged by the interim maintainer without a second human reviewer: CI and the mutation checks above are the independent checks. Fixes #2032 |
||
|
Alex B
|
893773338e |
chore(tests): move root test-*.js into tests/unit and tests/e2e (#2036)
Moves 290 root test-*.js into tests/unit (177, listed in test-all.sh) and tests/e2e (113, classified in scripts/non-unit-tests.json), per #1981 and PR-D of #1385. Root goes from 348 entries to 48. test-all.sh and test-fixtures/ stay put. The inventory guard now fails if a test reappears in the root or sits in the wrong folder.
Verified independently of the diff: the invoked sets are unchanged (test-all.sh 177 before and after, deploy.yml 96 before and after, both identical as sets), and a full local run of test-all.sh on master and on the branch produced 4702 output lines each whose only differences are absolute paths, stack-trace line numbers shifted by the REPO_ROOT line, the inventory wording and two perf ratios. The guard was mutation-checked: a test back in the root, a unit suite in tests/e2e, and a suite dropped from test-all.sh each make it exit 1. CI run 35246304316 ran 97 suites from tests/e2e and is green.
Follow-up
|
||
|
Sylvain Rabot
|
a2ea18f778 |
perf(sqlite): swap modernc.org/sqlite for mattn/go-sqlite3, cross-built with zig (#1992)
Swaps the SQLite driver from `modernc.org/sqlite` (pure Go, SQLite
3.46.0) to `github.com/mattn/go-sqlite3` (cgo, bundled SQLite 3.53.4),
and pays the resulting cross-compilation cost with `zig cc`.
Draft because the riskiest part of this deletes rows — see [Please
review this part first](#please-review-this-part-first) — and because
three things remain unverified at the bottom.
`modernc.org/sqlite` is a transpilation of the C amalgamation. This repo
is read-heavy: `cmd/server` chunk-loads a graph at startup and fans out
neighbour/topology/analytics queries per request, and it pays for that
transpilation on exactly those paths. Head-to-head on the same
120k-transmission / 240k-observation database, running our own hot-path
SQL under both drivers (Apple M4, `-count=5`, medians):
| workload | modernc | mattn | |
|---|---:|---:|---|
| chunk load (`chunked_load.go` v3 join, 20k tx) | 449ms | 196ms |
**2.3×** |
| aggregate scan (240k-row join + `GROUP BY`) | 276ms | 137ms | **2.0×**
|
| 1500 prepared-statement lookups | 512ms | 403ms | **1.3×** |
Allocations fall with it: 1.12M vs 1.64M allocs and 21MB vs 30MB on the
chunk load.
**Superseded by a production run.** @efiten measured both drivers on a
real instance — 11,077,038 observations, 9.7GB database, 4-core arm64 —
as server-only containers against the same live volume, one at a time,
with round 2 reversing the order so the page cache favours the old
driver:
| | audit 7d | audit 24h | background fill (13 chunks) | start →
/api/health |
|---|---:|---:|---:|---:|
| modernc, round 1 | 16.67s | 2.27s | 130.2s | 16.6s |
| mattn, round 1 | 7.87s | 1.34s | 93.8s | 13.5s |
| mattn, round 2 | 8.15s | 1.35s | 96.4s | 13.0s |
| modernc, round 2 | 13.46s | 2.29s | 137.8s | 15.5s |
Warm, the old driver improves to 13.46s on the 7d audit and still loses
by ~1.8×. Chunk load is ~1.4×. `/api/nodes?limit=500` is 0.039s against
0.037s — nothing.
**So the real gain is ~1.4–1.8× on the paths that matter, not 2–2.3×.**
The shape the harness predicted holds — scans and joins gain, small
lookups do not — which is more reassuring than the magnitude would have
been. Quote these numbers.
**The counterweight**, cold and native on that machine: a build goes
from **52s to 163s**. An instance that builds its own image pays that
per deploy.
## The build is cgo now, and one thing about that is a trap
**`CGO_ENABLED=0` still builds.** mattn links a stub, and the binary
dies on its first query with `go-sqlite3 requires cgo to work. This is a
stub`. A green build is not evidence of anything here, which is why
`AGENTS.md` now says so explicitly. `GOOS=linux go build` genuinely
cannot cross-compile any more.
A new root `Makefile` is the entry point. `make crossbuild` uses `zig cc
-target {x86_64,aarch64}-linux-musl` and links static, so each artifact
stays a single self-contained file and the `alpine:3.20` runtime no
longer depends on the base image's libc at all.
`-Wl,-s` is load-bearing: Go's own `-s -w` does not reach the musl
objects zig links in, and without it the server binary is 19.8MB instead
of 12.1MB.
The Dockerfile keeps its single `$BUILDPLATFORM` builder — still no QEMU
for compilation — and gains a checksum-pinned zig plus BuildKit cache
mounts. The mounts are not a nicety: without them an image build
recompiles the amalgamation from cold and takes over half an hour.
## Please review this part first
`internal/dbschema/dedup_index.go` **deletes observation rows**. It is
the one part of this change that can lose data, and it exists because
the migration exposed a real bug rather than causing one.
`stmtInsertObservation` resolves its `ON CONFLICT` against
`idx_observations_dedup`, which `cmd/ingestor/db.go` only ever created
inside the branch that creates the `observations` table for the first
time. Any database whose table predates that branch never got one, so
the UPSERT had no conflict target. modernc failed on the first insert;
mattn fails at `OpenStore`. Same bug, found earlier.
Creating the index unconditionally repairs it — but the index is what
was supposed to prevent duplicates, so a database that never had it can
already hold rows violating it. **`test-fixtures/e2e-fixture.db` in this
repo holds one.** So duplicates are collapsed first. Refusing is not the
safer option: without the index the ingestor cannot prepare its UPSERT,
so it cannot start at all.
Replaying that UPSERT faithfully is subtler than it looks, and a first
cut of this got it wrong twice:
- `COALESCE(excluded.x, x)` means the **incoming** value wins, so down a
group in id order the survivor keeps the **last** non-NULL value. Taking
the first silently discarded newer readings.
- The UPSERT names exactly five columns (`snr`, `rssi`, `score`,
`raw_hex`, `resolved_path`). Every other column must keep the surviving
row's own value; merging those too invents history the ingestor would
never have written.
Merge, delete and `CREATE UNIQUE INDEX` now share one transaction. Split
apart, a writer inserting a duplicate in the gap fails the index
creation while leaving the deletions committed — rows destroyed and no
index to show for it.
Cost, measured on 2.4M synthetic rows holding 5 duplicates: **4.1s**,
holding the write lock throughout, once, at ingestor startup before MQTT
subscribe. Materialising the duplicate-group scan once rather than per
column took that from 9.7s; the pathological case (400k of 600k rows
duplicated) is 5.7s, slightly worse than the 4.2s it was before that
change.
## Four more behavioural differences
Full detail in `docs/sqlite-driver-migration.md`. Briefly:
**Statement preparation is eager.** modernc's `newStmt` stored the SQL
and compiled lazily; mattn calls `sqlite3_prepare_v2` inside `Prepare`,
so SQL naming a missing table fails at *open*. 59 server tests failed on
this alone, all fixtures with partial schemas. `OpenDB` keeps failing
loudly (#1901; `main.go` gates on `dbschema.AssertReady` anyway) and the
fixtures now declare what they are prepared against via
`ensurePreparable`. This also exposed nine `nodes(pubkey …)`
declarations across seven files, where production has only ever had
`public_key` — lazy compilation had hidden the mismatch for as long as
it existed.
**`synchronous` silently dropped FULL → NORMAL.** mattn defaults it to
NORMAL and executes the pragma unconditionally, where SQLite's own
default (what modernc left alone) is FULL. In WAL mode that weakens
durability under power loss. Pinned in `dbschema.WriterDSN`, which both
writers now share — `cmd/migrate` kept a bare path at first and so
quietly wrote at NORMAL, which is what a second copy of a DSN buys you.
**The DSN dialects are mutually invisible.** modernc understood only
`_pragma=name(value)`, mattn only `_`-prefixed parameters, and neither
errors on the other's form — a driver-only rename would have dropped
every pragma in silence. `_journal_mode=WAL` is also gone from the
server's read handle: modernc ignored it, mattn honours it, and setting
`journal_mode` on a read-only connection is a write. Dropping
`_busy_timeout` with it costs nothing, since mattn already defaults to
5000ms — which means the read handle finally *gets* the busy timeout it
had silently lacked.
**`mode=ro` survives for a non-obvious reason.** mattn always passes
`READWRITE|CREATE` and its amalgamation has `SQLITE_USE_URI=0`; what
makes the URI work is its C wrapper ORing `SQLITE_OPEN_URI` in. So the
#1283/#1289 invariant holds with no build flags — but it depends on the
`file:` prefix. `cmd/decrypt` had been building its DSN without one, so
its `mode=ro` had never applied and a missing path was created
read-write. Fixed in passing; never a migration regression.
## What did not change
No modernc-specific API was in use: no `RegisterFunction`, no
`*sqlite.Conn`, no `sqlite/lib` error constants, no `sql.Register`. No
`time.Time` is ever bound as a query argument, so driver time handling
is not in play. Both drivers convert declared
`DATE`/`DATETIME`/`TIMESTAMP` columns to `time.Time`, so
`/api/dropped-packets` keeps emitting `dropped_at` as RFC3339 — an
earlier draft "fixed" that with a `CAST` and would have been the
regression.
## Tests and CI
New regression tests, each written because something got through without
it:
- `TestEnsureObservationsDedupIndexKeepsLatestValues` — the merge
ordering. The original test used complementary NULLs, which passes
whichever direction you pick, which is why the bug survived it.
- `TestCollapseDuplicatesAndIndexIsAtomic` — a failed index creation
must roll the deletions back.
- `TestOpenStorePragmas` / `TestWriterDSNPragmas` — every writer pragma,
read back through the store's own connection. A separate `sqlite3`
session or the startup log line would prove nothing.
- `TestOpenDBRefusesMissingDatabase` — the read-only invariant, which
now rests on a detail of the driver's C wrapper.
- `TestEnsurePreparableMatchesPrepareStatements` — fails when a new
prepared statement outgrows the fixture helper.
CI gains test execution for `cmd/migrate` and `internal/dbschema`, which
had none and both open the database. A PR-time two-arch build plus an
arm64 QEMU smoke gate is new: the GHCR push is push/tag-only, so without
it nothing on a PR would exercise zig, static musl linking or arm64, and
the first signal would arrive on master. `cache-dependency-path` widens
from 2 of the 5 tracked `go.sum` files to all of them.
`make test` passes across all 14 modules, `cmd/server` also under `-race
-count=2` with no failures and no races. `gofmt` and `go vet` clean.
Release-routing and Dockerfile COPY-invariant gates pass.
## Verified by running
- All 8 cross-builds static and correct-architecture; both arches of the
container image built, exported and run under QEMU, serving
`/api/health` and `/api/nodes` against a 2.9M-observation production
snapshot.
- The `migrate` binary repairing that snapshot's duplicate on bare
Alpine.
- `CGO_ENABLED=0` producing a binary that builds and then fails on first
query.
## Not verified
- ~~The 2–2.3× figures come from a standalone harness, not this load
under the old driver.~~ **Closed** by @efiten's production run above,
which also corrected the multiplier.
- SQLite 3.46.0 → 3.53.4 query-planner differences on queries with no
total `ORDER BY`.
- Sustained live ingest through the new writer DSN, and the duplicate
collapse against a database an ingestor is actively writing to. Verified
against a static snapshot only, and the collapse is measured at 4.1s on
2.4M synthetic rows with 5 duplicates — well short of an 11M-row
instance. @efiten has offered a staging instance taking real MQTT
traffic; **this is the item to close before the PR leaves draft.**
An earlier revision of this branch shipped the dedup merge in the wrong
direction with a green test suite, and review then found three more
things in the same file: the repair gated on an error string, a
non-atomic TEMP table drop aimed at the wrong connection, and a deletion
whose only record was a row count. All fixed in
|
||
|
n30nex
|
cd9b4c04d0 |
test: unify frontend test runs and prevent inventory drift (#1965)
Make `test-all.sh` the authoritative standalone frontend runner for npm and CI. Restore stale assertions and reject missing, duplicate, removed or undocumented inventory entries. Fixes #1858. Rebased onto `a2f039d4`. Retains release-routing, map scope-state and Scope Audit stylesheet tests, adds `test-packets-local-channels.js` to the sorted runner, and classifies `test-neighbor-map-btn-clip-e2e.js` under browser. Its separate CI browser step is preserved. Inventory: 280 root suites, 167 standalone, 113 requiring separate setup. The icon repair fixes two suites red on master: `test-issue-1648-m2-emoji-scan.js` and `test-issue-1648-m6-final-sweep.js`. Node/live configured-scope confirmations now use the existing accessible Phosphor check sprite. Values, visibility conditions and scanner assertions are preserved. - Red evidence: `89e45a9` inventory assertions; `4e255df` accessible confirmation assertion. The latest rebase also reproduced both unclassified-file failures before adding their entries. This follow-up only changes runner/classification configuration and counts; no test files modified. - Local validation: all 167 standalone suites; 27 M2 browser checks and 16 neighbor geometry checks in Chromium. Syntax, whitespace, PII, CSS-variable and XSS checks passed. - Browser coverage includes populated/empty/null configured scopes in node and live views. - No new dependencies, requests, application settings or Go changes. Workflow outside the unit step matches master. - Windows validation uses process-local UTF-8 settings. Encoding and node-reach confirmation follow-ups remain separate, as requested. ## Preflight override External `run-all.sh` is unavailable; applicable repository checks were run directly. |
||
|
|
a2004351d3 |
fix(#1684): staging disk monitor + cleanup cron (#1686)
## Summary Adds a staging VM disk-usage monitor + daily cleanup cron, fixing the gap surfaced by #1684 (staging hit 100% disk during a hot-patch, no alert, no cleanup). ## What landed - **`scripts/staging/disk-monitor.sh`** — parses `df -P <mount>`, classifies usage `<80 ok / >=80 warn / >=90 error / >=95 alert`, emits to stderr + journald via `logger -p`, exits non-zero on `error|alert` so the systemd unit surfaces as failed. - **`scripts/staging/disk-cleanup.sh`** — daily prune of `/tmp` snapshot patterns (`*.db`, `staging-snap.*`, `cs-*`, `node-compile-cache`) older than 7d + `docker builder/image prune --filter until=72h --filter label!=keep`. Honors `CORESCOPE_CLEANUP_DRY_RUN=1`. - **`scripts/staging/test-disk-monitor.sh`** — pure-bash unit tests for the testable helpers (22 cases covering threshold boundaries, df parsing, invalid input, severity→priority mapping). - **`DEPLOY.md`** — install one-liner with full inline systemd unit + timer content (15-min monitor, daily 03:30 cleanup). Uses `<STAGING_HOST>` placeholder. - **`.github/workflows/deploy.yml`** — wires `test-disk-monitor.sh` into the Go build & test job. ## TDD - Commit `26185967` (RED): tests against stub helpers — `PASS=5 FAIL=17` on assertions. - Commit `d31a1082` (GREEN): real helpers — `PASS=22 FAIL=0`. ## Phase 3 — `staging-snap.db` root cause `grep -rn staging-snap.db cmd/ public/ scripts/` → **zero hits**. The 4.4 GB orphan was a manual debug artifact, not committed code. The cleanup retention rule prevents recurrence. Partial fix for #1684 — leaves issue open for operator to verify install on staging and confirm alert fires at 85%. --------- Co-authored-by: corescope-bot <bot@corescope.local> Co-authored-by: clawbot <bot@openclaw.dev> |
||
|
Kpa-clawbotandopenclaw-bot
|
55e4d957b1 |
M1: emoji → Phosphor Icons — top-nav, mobile nav, Compare (#1648) (#1649)
Red commit:
|
||
|
|
63bfa3d910 |
feat(security): detect CDN-fronted deployment + document bypass requirement (closes #1561) (#1564)
Closes #1561. Follow-up to #1551. ## Why #1551 added `Cache-Control: no-store` to all `/api/*` responses. That's sufficient for CDNs that honour origin headers (Varnish, nginx). It is **not** sufficient for Cloudflare zones where Cache Rules / Page Rules override origin Cache-Control. Field evidence from the meshat.se diagnosis (2026-06-04): observers behind Cloudflare were returning `cf-cache-status: HIT` with `age` up to ~6 hours despite the origin emitting `no-store`. The CDN was caching per zone policy and ignoring the upstream directive — exactly the failure mode #1551 cannot reach. The application has no way to inject CDN rules; the only durable fix is operator-side. This PR makes that operator step discoverable and verifiable. ## What ### Server-side detection (log-only) `cmd/server/cdn_detection.go` adds a middleware wired into the `/api/*` chain after `noStoreAPIMiddleware`. On the **first** request bearing any CDN-typical header (`CF-Connecting-IP`, `CF-Ray`, `X-Forwarded-For`, `X-Real-IP`, `Fastly-Client-IP`, `True-Client-IP`) it logs: ``` [security] WARNING: detected request via CDN (CF-Ray header present). Ensure /api/* is bypassed in your CDN config — see docs/deployment-behind-cdn.md. Cached API responses cause observer-flap and incorrect dashboards. ``` `sync.Once` guarantees the warning fires at most once per process boot. The middleware never blocks, never modifies the response, never adds headers. Detection is observational only — operators who run behind a CDN without bypass have a real bug; the warning is appropriate. ### Operator documentation `docs/deployment.md` gains a new **"Behind a CDN (Cloudflare, Fastly)"** section covering: 1. Curl verification command + healthy vs unhealthy output examples 2. Cloudflare Cache Rule creation (URI Path starts-with `/api/` → Bypass cache) 3. Legacy Page Rules equivalent 4. Fastly note 5. Re-verification 6. Meaning of the startup log warning 7. Why we can't fix this server-side `docs/deployment-behind-cdn.md` is the canonical path the log message references — it's a short TL;DR that links back to the full section. ### Healthcheck script `scripts/check-cdn-bypass.sh` — POSIX sh, no dependencies beyond curl + grep + awk. Operators run: ```sh scripts/check-cdn-bypass.sh https://your-domain.example.com ``` Exits `0` with `OK: no CDN caching detected ...` or `1` with a precise diagnostic naming the offending header (`cf-cache-status: HIT` or stale `age`). ## TDD - **Red commit `e90ccaba`** (`test(security): RED ...`) — `cmd/server/cdn_detection_test.go` (4 Go tests + 6 subtests for each header) and `scripts/test-check-cdn-bypass.sh` (3 shell harness cases). Middleware stub returns `next` unchanged so tests compile and fail on assertions, not build errors. - **Green commit `5e6a60b5`** (`feat(security): GREEN ...`) — real middleware, wiring in `routes.go`, healthcheck script, doc. ## Deliverables | File | Status | Purpose | |------|--------|---------| | `cmd/server/cdn_detection.go` | new | middleware + sync.Once warning | | `cmd/server/cdn_detection_test.go` | new | 4 Go tests (1 stand-alone + 1 silence + 1 once + 1 table-driven over 6 headers) | | `cmd/server/routes.go` | modified | `r.Use(cdnDetectionMiddleware)` after no-store | | `docs/deployment.md` | modified | TOC entry + "Behind a CDN" section | | `docs/deployment-behind-cdn.md` | new | canonical path referenced by log message + script output | | `scripts/check-cdn-bypass.sh` | new | operator-runnable healthcheck | | `scripts/test-check-cdn-bypass.sh` | new | shell harness with fake curl | ## What this PR explicitly does NOT do - Does not block requests based on CDN detection (log-only). - Does not enforce CDN bypass (impossible — operator-controlled). - Does not spoof, strip or modify CDN headers. - Does not add CSP / HSTS / other security headers (out of scope). - Warning is not configurable — operators behind a CDN without bypass have a real bug, surfacing it is correct. ## Verification - `go test ./...` in `cmd/server/` — full suite green. - `sh scripts/test-check-cdn-bypass.sh` — 3/3 pass. - Preflight checklist — all 11 gates clean (PII, branch scope, red commit, CSS vars, CSS self-fallback, LIKE-on-JSON, sync migration, async-migration annotation, XSS sinks, img/SVG ratio, themed-img/SVG, fixture coverage). --------- Co-authored-by: openclaw-bot <bot@openclaw.local> Co-authored-by: clawbot <bot@clawbot.invalid> |
||
|
|
e4a21fc9ab |
feat(preflight): hard-fail gate on unescaped node-controlled HTML sinks (#1543)
## Summary Closes the "XSS regression in newly-added sink" class. Follow-up to #1537 (10 stored-XSS sinks in node names) and the post-#1537 audit (TRACE-1, OBS-1, ANL-1 — 3 additional HIGH XSS in files #1537 didn't touch). After those fixes land, the project still has **zero automated catch for the next one**. Every future PR can re-introduce the same class freely. This PR closes that gap with a hard-fail pr-preflight gate that runs at PR-creation time and in CI. ## What the gate does A NEW or MODIFIED line in the PR diff under `public/**/*.{js,html}` is flagged when it matches any of these sink patterns: | Pattern | What it catches | |---|---| | `.innerHTML = \`…\`` / `'…'` | template-literal or string-concat HTML injection | | `insertAdjacentHTML(…, \`…\`)` | DOM-adjacent injection | | `.bindPopup(\`…\`)` / `.bindTooltip(\`…\`)` | Leaflet popup/tooltip injection (the OBS-1 class) | | `.setAttribute('on<event>', …)` | inline event-handler injection | | `.setAttribute('href'\|'src'\|'action'\|'formaction', <interp>)` | `javascript:` URI class | For each flagged line, the gate then walks the dynamic substring (`${…}`, post-`+`, or `setAttribute` value arg) and only fires if it interpolates an identifier from the node-controlled allowlist (`name`, `observer`, `sender`, `pubkey`, `body`, `hash`, …). This keeps the regex off static CSS classes like `text-center`. A flagged line is accepted (no fail) when ANY of: - **(a)** wrapped in `escapeHtml(` / `escapeAttr(` / `safeEsc(` / local `esc(` — the audited helpers - **(b)** a same-PR `test*.js` file DOM-greps the audit payload (`' onfocus=` or `onerror=alert`) AND references the sink file's basename - **(c)** the PR body carries `PREFLIGHT-XSS-OPTOUT: <file>:<line> reason="…"` — explicit author opt-out logged for reviewer attention Otherwise: **HARD FAIL** with `file:line: flagged: <token>` plus a suggested fix. ## Split - **Skill directory** (local, no PR): - `~/.openclaw/skills/pr-preflight/scripts/check-xss-sinks.sh` — canonical gate - `~/.openclaw/skills/pr-preflight/data/xss-node-controlled-fields.txt` — allowlist (27 identifiers, easy to extend without a repo PR) - wired into `~/.openclaw/skills/pr-preflight/scripts/run-all.sh` - **This PR** (in repo): - `testdata/preflight-xss/` — fixtures (`bad-1..bad-3`, `good-1..good-2`, `test-good-2.js`) - `scripts/check-xss-sinks.sh` — local mirror of the canonical gate, so CI can exercise the gate without depending on the skill dir - `test-preflight-xss-gate.js` — Node test wrapper that asserts bad fixtures fail (exit 1) and good fixtures pass (exit 0) - `public/app.js` — `escapeHtml` docstring marked CANONICAL with links to the enforcing gate - `.github/workflows/deploy.yml` — invoke `node test-preflight-xss-gate.js` alongside the existing `test-xss-escape-sinks.js` ## TDD red → green | | Commit | Test result | |---|---|---| | **Red** | `test(preflight-xss): RED — fixtures + assertion wrapper for XSS sink gate` | `test-preflight-xss-gate.js` exits 1 — bad fixtures unexpectedly pass because `scripts/check-xss-sinks.sh` is a no-op stub. Genuine assertion failure (not a build error). | | **Green** | `feat(preflight): GREEN — implement XSS-sink check + escapeHtml docstring` | stub replaced with real check; all 5 fixtures behave as expected. | The red commit ships a working stub script so the test runs to completion and fails on an **assertion**, not on a missing-file error. ## Coverage proof — would the gate have caught the originals? - **PR #1537 (10 sinks):** synthetic file from the deleted lines of #1537 → gate flags `n.name` in `innerHTML \`tpl\`` and two `bindPopup(\`…${n.name}\`)` lines. Yes, the gate would have caught these the moment they hit a PR diff. - **Post-#1537 audit:** - **TRACE-1** (`traces.js` `${e.message}` / `${urlHash}` in innerHTML): yes — the `hash`/`urlHash` tokens are allowlisted and the innerHTML template-literal pattern matches. - **OBS-1** (`observer-detail.js` URL fragment + MQTT fields into innerHTML / bindPopup): yes — the `observer`, `text`, `hash` tokens are allowlisted and both sink patterns match. - **ANL-1** (`analytics.js` attribute-mutation roundtrip): yes for `setAttribute('on*', …)` and `setAttribute('href', \`…${interp}…\`)` patterns. (Note: pure innerHTML lines with only `${e.message}` are not node-controlled and are intentionally not flagged.) ## Allowlist (initial 27 identifiers) ``` adv_name name observer observer_name sender from_node channel channel_name model firmware client_version radio iata hopNames nodeLabel obsName n.name o.name obs.name public_key pubkey area_key region_name text body message preview hash urlHash ``` Extend in `~/.openclaw/skills/pr-preflight/data/xss-node-controlled-fields.txt` whenever a new node-controlled field surfaces in an audit — no repo PR required. ## Hard rules respected - No build step, no ESLint plugin, no AST analysis — grep + heuristics + opt-out escape valves - Hard fail (exit 1), not warning-only (exit 2) - PII preflight grep on every commit + this PR body - Same split as the sibling migration-gate PR ## Three-axis merge-readiness - **Mergeable:** yes — branch is clean off `origin/master`, no conflicts - **CI:** will report on push; red commit expected to fail, green commit expected to pass - **Threads:** none open yet (new PR) --------- Co-authored-by: meshcore-bot <bot@local> Co-authored-by: mc-bot <bot@meshcore.local> Co-authored-by: corescope-bot <bot@corescope> |
||
|
efitenandClaude Sonnet 4.6
|
8151185ede |
fix(ci): Dockerfile COPY invariant check — prevent missing internal/<pkg> Docker failures (#1316) (#1432)
## Summary - Adds `scripts/check-dockerfile-internal-pkgs.sh`: reads `replace => ../../internal/<pkg>` directives from `cmd/server/go.mod` and `cmd/ingestor/go.mod`, then verifies each referenced package has the correct number of `COPY internal/<pkg>/` lines in `Dockerfile` (one per builder section that needs it) - Wired into CI as a step in the `go-test` job, before CSS lint — runs on every PR, adds ~0.1s - Prevents the recurring failure pattern (#1316): new `internal/<pkg>` added to go.mod but COPY line forgotten in Dockerfile; non-Docker CI passes, Docker build fails after merge with a cryptic module error Key details: - Counts COPY occurrences per package: if a pkg is referenced in both go.mods (both binaries need it), it must appear in at least 2 builder sections - Anchored regex: only matches actual `replace` directives (not comments) - Anchored grep: skips commented-out `COPY internal/...` lines Closes #1316. ## Test plan - [ ] Run `bash scripts/check-dockerfile-internal-pkgs.sh` locally — exits 0 on current Dockerfile - [ ] Manually remove a `COPY internal/perfio/` line from Dockerfile → script exits 1 with a clear error - [ ] CI step visible in the `go-test` job on this PR 🤖 Generated with [Claude Code](https://claude.com/claude-code) Co-authored-by: Claude Sonnet 4.6 <noreply@anthropic.com> |
||
|
Kpa-clawbotandopenclaw-bot
|
e267fb754d |
fix(ci): aggregate e2e pass/fail across all suites instead of broken digits-before-slash regex (#1298)
RED |
||
|
Kpa-clawbotandOpenClaw Bot
|
43203b09b7 |
fix(#1249): IATA badge missing on fixture + mobile clipping (#1252)
Failing test commit: `bdb4eefb` (added in #1189 R1) — original CI failure: https://github.com/Kpa-clawbot/CoreScope/actions/runs/25995819598 Fixes #1249. ## Root cause Two independent bugs surfaced by the same E2E test: 1. **Fixture join broken.** `scripts/capture-fixture.sh` wrote the text observer hash into `observations.observer_idx`, but the v3 join in `cmd/server` is `observers.rowid = observations.observer_idx`. The join silently nulled out `observer_id` / `observer_iata` for every packet. 2. **Mobile clipping.** `.col-observer` had `data-priority=3` (hides at ≤1024px) and was in the narrow-viewport `defaultHidden` list, so at 375px the cell collapsed to `display:none` and `.badge-iata` had a 0×0 box. ## Changes - `test-fixtures/e2e-fixture.db`: remap `observer_idx` text hash → integer rowid (500/500 rows resolved). - `scripts/capture-fixture.sh`: build an `observer_id → rowid` map before insert; skip rows whose observer isn't in the fixture. Comment explains the trap. - `public/packets.js`: bump `.col-observer` priority `3 → 1` and drop `observer` from narrow-viewport `defaultHidden`. ## Verification All three sub-tests in `test-observer-iata-1188-e2e.js` pass locally against the freshened fixture. `curl /api/packets?limit=5` returns real IATA codes (OAK / MRY / SFO) instead of empty strings. Co-authored-by: OpenClaw Bot <bot@openclaw.local> |
||
|
Kpa-clawbotandopenclaw-bot
|
eae1b915ca |
feat: load Aldrich webfont for #1137 logo SVG (#1138)
Adds Aldrich webfont so the merged #1137 logo renders in the intended typeface. ## Problem The inline SVG logo merged in #1137 declares `font-family="Aldrich, monospace"` in `public/index.html` and `public/home.js`, but the page never loaded the Aldrich font face. Browsers silently fell back to monospace. ## Fix Self-hosted webfont: - `public/fonts/aldrich-regular.woff2` — Regular 400, ~16KB, downloaded from Google Fonts (latin subset). Self-hosted to avoid third-party CDN dependency, privacy concern, and FOUT delay. - `@font-face` declaration added at the top of `public/style.css` with `font-display: swap`. Aldrich only ships in 400; the SVG `font-weight="700"` on the wordmark synthesizes bold (matches the design intent of #1137). ## TDD - Red commit: E2E test asserting `document.fonts.check('1em Aldrich')` is true and the navbar SVG `<text>` `font-family` contains "Aldrich". Without the font face declaration, both assertions fail on an assertion (not a build error). - Green commit: adds the woff2 + `@font-face` rule, both assertions pass. ## Files - `public/fonts/aldrich-regular.woff2` (new, 16460 bytes) - `public/style.css` — `@font-face` rule - `test-e2e-playwright.js` — new test --------- Co-authored-by: openclaw-bot <bot@openclaw.local> |
||
|
|
494d3022f9 |
Partial fix for #1128: close audit gaps (z-scale, css-var lint, multi-viewport E2E, Bug 1+5 polish) (#1133)
## Partial fix for #1128 — closes the gaps PR #1131 left behind PR #1131 was a partial fix for the packets-page layout chaos (merged 2026-05-06 ~01:55 UTC, then the issue was reopened by the maintainer). #1131 shipped Bug 4 (`--surface` definition), the `.path-popover` flip + lower z-index, the debounced re-measure for Bug 1, the `.filter-bar` row-gap + `.multi-select-trigger` truncation for Bug 3, the new z-index TOKENS, and a single-viewport E2E with five individual-component assertions. This PR closes everything else the issue body and the `specs/packets-layout-audit.md` audit asked for. ### What changed (per gap) **Gap A — apply the z-index scale (audit Section 2)** #1131 added `--z-dropdown` / `--z-popover` / `--z-modal` / `--z-tooltip` but explicitly left existing literal values in place. This PR renumbers the 7 dropdowns/popovers the audit named: | Selector | Before | After | |---|---:|---:| | `.col-toggle-menu` | 50 | `var(--z-dropdown)` (100) | | `.multi-select-menu` | 90 | `var(--z-dropdown)` | | `.region-dropdown-menu` | 90 | `var(--z-dropdown)` | | `.node-filter-dropdown` | 100 | `var(--z-dropdown)` | | `.fux-saved-menu` | `var(--z-tooltip)` (9200) | `var(--z-dropdown)` | | `.fux-ac-dropdown` | `var(--z-tooltip)` | `var(--z-dropdown)` | | `.hop-conflict-popover` | `var(--z-tooltip)` | `var(--z-popover)` (300) | `.fux-ctx-menu` deliberately retains the tooltip band — context menus must float above all toolbar UI. `.region-filter-options-menu` no longer exists in the source (was renamed `.region-dropdown-menu`). The `style.css` doc-block at the top is rewritten to record the applied scale and to point operators at the new lint. **Gap B — CSS-var lint (audit Section 5 #1, "single highest-value addition")** Adds `scripts/check-css-vars.js` (~70 lines). Walks `public/*.css`, extracts every `var(--name)` reference WITHOUT a fallback, asserts the name is defined in some `public/*.css`. References WITH a fallback are tolerated. Wired into CI in the `go-test` job before the JS unit tests. The red commit (`608d81f`) shipped this lint exiting 1 against the master tree — three undefined vars that bypassed earlier review: ``` public/style.css:2628 var(--text-primary) public/style.css:2675 var(--bg-hover) public/style.css:2924 var(--primary) ``` The green commit (`1369d1e`) defines those three as aliases in the :root block (`--text-primary` → `--text`, `--bg-hover` → `--hover-bg`, `--primary` → `--accent`). Light + dark themes inherit through the existing tokens. **Gap C — multi-viewport E2E (issue acceptance criterion)** Adds `test-issue-1128-multi-viewport-e2e.js` — sister of the existing single-viewport test. At each of three viewports (1280×900, 1080×800, 768×1024): - takes a screenshot to `e2e-screenshots/issue-1128-<viewport>.png` - asserts no two `.filter-group` siblings vertically overlap - on desktop+laptop, opens the Saved menu and the Types multi-select and asserts the dropdown does not vertically overlap any `.filter-group` below it Plus three viewport-agnostic assertions: - dropdown selectors compute z-index in `[100,199]` (`.col-toggle-menu`, `.multi-select-menu`, `.region-filter-options-menu`, `.fux-saved-menu`, `.fux-ac-dropdown`) - `.path-hops .hop / .hop-named / .arrow` compute `line-height ≤ 18px` - `.col-path` computes `height ≤ 28px` Wired into the e2e-test job after the existing #1128 test. **Gap D — Bug 5 polish (toolbar reorder)** Audit Section 3 Bug 5: swaps `filter-group-dropdowns` and `filter-group-toggles` in `public/packets.js` so time range + Group by Hash + ★ My Nodes sit next to the search input. Pure markup reorder. No CSS / no JS-handler changes. **Gap E — Bug 1 belt-and-suspenders** Audit Section 3 Bug 1 sub-bullets: - locks `.path-hops .hop / .hop-named / .arrow` to `line-height: 18px` so a chip with mixed font metrics cannot overflow the 22px host vertically and bleed into the row above - converts `.col-path { max-height: 28px }` → `height: 28px` because browsers widely ignore `max-height` on `<td>`s; the earlier rule was a no-op ### TDD discipline (red → green) ``` $ git log --oneline origin/master..HEAD |
||
|
|
364c5766fc |
feat(logo): wire new CoreScope SVG logo into navbar + home hero (#1137)
## Adds new logo and home hero Replaces the navbar mushroom emoji + "CoreScope" text spans with the new CoreScope SVG mark, and adds a hero SVG (with the MESH ANALYZER tagline) above the home page H1. ### What changed - `public/img/corescope-logo.svg` — navbar mark, no tagline (locked "aggressive low-amp chirp" variant: facing-arcs + low-amp chirp connector between the two nodes). - `public/img/corescope-hero.svg` — home hero version, includes the MESH ANALYZER tagline. - `public/index.html` — replaces `<span class="brand-icon">🍄</span><span class="brand-text">CoreScope</span>` with `<img class="brand-logo" src="img/corescope-logo.svg?__BUST__" …>`. `.nav-brand` link still routes to `#/`. `.live-dot` retained. - `public/style.css` — adds `.brand-logo { height: 36px }` (32px on tablet ≤900px). Existing 52px nav height unchanged. - `public/home.js` / `public/home.css` — adds `<img class="home-hero-logo">` above the hero `<h1>`, sized `max-width: min(720px, 90vw)` and centered. ### TDD Red→green is visible in the branch: - `3159b82` — `test(logo): add failing E2E …` (red commit). Adds `test-logo-rebrand-e2e.js` and wires it into the `e2e-test` job in `deploy.yml` with `CHROMIUM_REQUIRE=1`. On this commit `index.html` still has the emoji + text spans, `home.js` has no hero img, and the SVG asset files do not exist — the test asserts on each so CI fails on assertion. - `19434e1` — `feat(logo): wire new CoreScope SVG logo …` (green commit). Implements the fix. ### E2E asserts 1. `.nav-brand img` exists with `src` ending `corescope-logo.svg` 2. legacy `.brand-icon` / `.brand-text` are gone 3. `.live-dot` is present, visible, and to the right of the logo (no overlap) 4. `.home-hero img.home-hero-logo` exists with `src` ending `corescope-hero.svg`, positioned BEFORE the `<h1>` 5. both `/img/corescope-{logo,hero}.svg` return 200 with svg content-type ### Customizer compatibility - `customize.js` still does `querySelector('.brand-text')` / `.brand-icon` for live branding updates. Both now return `null`; existing `if (el)` guards make those branches silent no-ops. **No JS errors, but the customizer's `branding.siteName` and `branding.logoUrl` fields no longer rewrite the navbar brand** — the brand is now a fixed SVG asset. - **Theme accent does NOT recolor the SVG.** SVGs loaded via `<img src>` are isolated documents and cannot inherit document CSS variables; the SVG falls back to its embedded brand colors. This is appropriate for a brand mark; if recoloring per theme is desired later, swap to inline SVG (separate PR). ### Browser validation Local Chromium not available in this env; the E2E test soft-skips locally and hard-fails in CI (`CHROMIUM_REQUIRE=1`). Server-side checks done locally: - `curl http://localhost:13581/` → confirmed `<img class="brand-logo" src="img/corescope-logo.svg?<bust>" …>` rendered, no `.brand-icon`/`.brand-text` spans. - `curl -I /img/corescope-logo.svg` and `/img/corescope-hero.svg` → both 200. ### Performance No hot-path changes. Two new static SVG assets (~7.6KB each), served directly by the Go static handler. Cache-busted via `?__BUST__` (auto-replaced server-side). --------- Co-authored-by: OpenClaw Bot <bot@openclaw.local> Co-authored-by: Kpa-clawbot <bot@kpa-clawbot.local> |
||
|
|
ac0cf5ac7d |
fix(channels): #1087 QR library + share modal + PSK persistence (#1090)
Red commit: 5def4d073c61058fc9f327a3c60ece27e21cbc69 (CI run pending — see Checks tab) Fixes #1087 ## What's broken (4 bugs) 1. **"QR library not loaded"** — `channel-qr.js` checked `root.QRCode` (capital), but the vendored library exports lowercase `qrcode` (Kazuhiko Arase API). Generate & Show QR always fell into the "library not loaded" branch. 2. **QR encodes `name=psk:hex`** — the Share button (and parts of the Generate path) passed the internal `psk:<hex8>` lookup key to `ChannelQR.generate`, ignoring the user's display label stored in `LABELS_KEY`. 3. **PSK channel doesn't persist on refresh** — the persistence path was scattered, and the read-back wasn't verified. Added channels disappeared on refresh and "reappeared" only when a later add ran the persist hook. 4. **Share button reuses the Add Channel modal** — wrong intent reuse (Add = INPUT, Share = OUTPUT). Replaced with a dedicated `#chShareModal` (separate DOM id, separate title, share-only affordances, privacy warning). ## TDD Red commit (this) lands ONLY the failing tests: - `test-channel-issue-1087.js` — source-string contract assertions for all 4 bugs - `test-channel-issue-1087-e2e.js` — Playwright E2E covering generate → QR render, QR display name, persistence across refresh, Share opens dedicated modal Green commit (follow-up) lands the production fixes. ## E2E assertion added E2E assertion added: test-channel-issue-1087-e2e.js:55 ## CI wiring - `test-channel-issue-1087.js` added to `.github/workflows/deploy.yml` (go-test JS unit step) + `test-all.sh` - `test-channel-issue-1087-e2e.js` added to `.github/workflows/deploy.yml` (e2e-test step) --------- Co-authored-by: bot <bot@corescope> Co-authored-by: meshcore-bot <bot@meshcore.local> Co-authored-by: clawbot <clawbot@users.noreply.github.com> |
||
|
Kpa-clawbotandyou
|
a8e1cea683 |
fix: use payload type bits only in content hash (not full header byte) (#787)
## Problem The firmware computes packet content hash as: ``` SHA256(payload_type_byte + [path_len for TRACE] + payload) ``` Where `payload_type_byte = (header >> 2) & 0x0F` — just the payload type bits (2-5). CoreScope was using the **full header byte** in its hash computation, which includes route type bits (0-1) and version bits (6-7). This meant the same logical packet produced different content hashes depending on route type — breaking dedup and packet lookup. **Firmware reference:** `Packet.cpp::calculatePacketHash()` uses `getPayloadType()` which returns `(header >> PH_TYPE_SHIFT) & PH_TYPE_MASK`. ## Fix - Extract only payload type bits: `payloadType := (headerByte >> 2) & 0x0F` - Include `path_len` byte in hash for TRACE packets (matching firmware behavior) - Applied to both `cmd/server/decoder.go` and `cmd/ingestor/decoder.go` ## Tests Added - **Route type independence:** Same payload with FLOOD vs DIRECT route types produces identical hash - **TRACE path_len inclusion:** TRACE packets with different `path_len` produce different hashes - **Firmware compatibility:** Hash output matches manual computation of firmware algorithm ## Migration Impact Existing packets in the DB have content hashes computed with the old (incorrect) formula. Options: 1. **Recompute hashes** via migration (recommended for clean state) 2. **Dual lookup** — check both old and new hash on queries (backward compat) 3. **Accept the break** — old hashes become stale, new packets get correct hashes Recommend option 1 (migration) as a follow-up. The volume of affected packets depends on how many distinct route types were seen for the same logical packet. Fixes #786 --------- Co-authored-by: you <you@example.com> |
||
|
efitenandClaude Sonnet 4.6
|
fe314be3a8 |
feat: geo_filter enforcement, DB pruning, geofilter-builder tool, HB column (#215)
## Summary

Several features and fixes from a live deployment of the Go v3.0.0
backend.

### geo_filter — full enforcement

- **Go backend config** (`cmd/server/config.go`,
`cmd/ingestor/config.go`): added `GeoFilterConfig` struct so
`geo_filter.polygon` and `bufferKm` from `config.json` are parsed by
both the server and ingestor
- **Ingestor** (`cmd/ingestor/geo_filter.go`, `cmd/ingestor/main.go`):
ADVERT packets from nodes outside the configured polygon + buffer are
dropped *before* any DB write — no transmission, node, or observation
data is stored
- **Server API** (`cmd/server/geo_filter.go`, `cmd/server/routes.go`):
`GET /api/config/geo-filter` endpoint returns the polygon + bufferKm to
the frontend; `/api/nodes` responses filter out any out-of-area nodes
already in the DB
- **Frontend** (`public/map.js`, `public/live.js`): blue polygon overlay
(solid inner + dashed buffer zone) on Map and Live pages, toggled via
"Mesh live area" checkbox, state shared via localStorage

### Automatic DB pruning

- Add `retention.packetDays` to `config.json` to delete transmissions +
observations older than N days on a daily schedule (1 min after startup,
then every 24h). Nodes and observers are never pruned.
- `POST /api/admin/prune?days=N` for manual runs (requires `X-API-Key`
header if `apiKey` is set)

```json
"retention": {
  "nodeDays": 7,
  "packetDays": 30
}
```

### tools/geofilter-builder.html

Standalone HTML tool (no server needed) — open in browser, click to
place polygon points on a Leaflet map, set `bufferKm`, copy the
generated `geo_filter` JSON block into `config.json`.

### scripts/prune-nodes-outside-geo-filter.py

Utility script to clean existing out-of-area nodes from the database
(dry-run + confirm). Useful after first enabling geo_filter on a
populated DB.

### HB column in packets table

Shows the hop hash size in bytes (1–4) decoded from the path byte of
each packet's raw hex. Displayed as **HB** between Size and Type
columns, hidden on small screens.

## Test plan

- [x] ADVERT from node outside polygon is not stored (no new row in
nodes or transmissions)
- [x] `GET /api/config/geo-filter` returns polygon + bufferKm when
configured, `{polygon: null, bufferKm: 0}` when not
- [x] `/api/nodes` excludes nodes outside polygon even if present in DB
- [x] Map and Live pages show blue polygon overlay when configured;
checkbox toggles it
- [x] `retention.packetDays: 30` deletes old transmissions/observations
on startup and daily
- [x] `POST /api/admin/prune?days=30` returns `{deleted: N, days: 30}`
- [x] `tools/geofilter-builder.html` opens standalone, draws polygon,
copies valid JSON
- [x] HB column shows 1–4 for all packets in grouped and flat view

🤖 Generated with [Claude Code](https://claude.com/claude-code)

---------

Co-authored-by: Claude Sonnet 4.6 <noreply@anthropic.com>
|
||
|
Kpa-clawbotandyou
|
a555b68915 |
feat: expand frontend coverage collector for 60%+ target (#275)
## Summary

Expands the parallel frontend coverage collector to boost coverage from
~43% toward 60%+. This covers Phases 1 and 2 of the coverage improvement
plan.

### Phase 1 — Visit unvisited pages

- **Compare page** (`#/compare`): Navigates with query params selecting
two real observers from fixture DB, also exercises UI controls
- **Node analytics** (`#/nodes/{pubkey}/analytics`): Visits analytics
for two real nodes from fixture DB, clicks day buttons
- **Traces search** (`#/traces`): Searches for two valid packet hashes
from fixture DB
- **Personalized home**: Sets `localStorage.myNodes` with real pubkeys
before visiting `#/home`
- **Observer detail pages**: Direct navigation to
`#/observers/test-obs-1` and `#/observers/test-status-obs`
- **Real packet detail**: Navigates to `#/packets/b6b839cb61eead4a`
(real hash)
- **Rapid route transitions**: Exercises destroy/init cycles across all
pages
- **Compare in route list**: Added to the full route transition exercise

### Phase 2 — page.evaluate() for interactive code paths

| File | Functions exercised |
|------|-------------------|
| **live.js** | `vcrPause`, `vcrSpeedCycle`, `vcrReplayFromTs`,
`drawLcdText`, `vcrResumeLive`, `vcrUnpause`, `vcrRewind`,
`updateVCRClock`, `updateVCRLcd`, `updateVCRUI`, `bufferPacket`
(synthetic WS packets), `dbPacketToLive`, `renderPacketTree` |
| **packets.js** | `renderDecodedPacket` (ADVERT + GRP_TXT), `obsName`,
`renderPath`, `renderHop` |
| **packet-filter.js** | 30+ filter expressions now **evaluated against
4 synthetic packets** (previously only compiled, not run). Covers
`resolveField` for all field types including `payload.*` dot notation |
| **nodes.js** | `getStatusInfo`, `renderNodeBadges`,
`renderStatusExplanation`, `renderHashInconsistencyWarning` with varied
node types/roles |
| **roles.js** | `getHealthThresholds` (all roles), `getNodeStatus` (all
roles × active/stale), `getTileUrl`, `syncBadgeColors`, `miniMarkdown`
(bold, italic, code, links, lists), `copyToClipboard` |
| **channels.js** | `hashCode`, `getChannelColor`, `getSenderColor`,
`highlightMentions`, `formatSecondsAgo` |
| **app.js** | `escapeHtml`, `debouncedOnWS`, extended
`timeAgo`/`truncate` edge cases, extended
`routeTypeName`/`payloadTypeName`/`payloadTypeColor` ranges |

### What changed

- `scripts/collect-frontend-coverage.js` — +336 lines across existing
groups (no new groups added)

### Testing

- `npm test` passes (all 13 tests)
- No other files modified

Co-authored-by: you <you@example.com>
|
||
|
Kpa-clawbotandyou
|
5777780fc8 |
refactor: parallel coverage collector (~30-60s vs 8min) (#272)
## Summary Redesigned frontend coverage collector with 7 parallel browser contexts. Coverage collector runs on master pushes only (skipped on PRs). ### Architecture 7 groups run simultaneously via `Promise.allSettled()`: - G1: Home + Customizer - G2: Nodes + Node Detail - G3: Packets + Packet Detail - G4: Map - G5: Analytics + Channels + Observers - G6: Live + Perf + Traces + Globals - G7: Utility functions (page.evaluate) ### Speed gains - `safeClick` 500ms → 100ms - `navHash` 150ms → 50ms - Removed redundant page visits and E2E-duplicate interactions - Wall time = slowest group (~30-60s estimated) ### 821 lines → ~450 lines Each group writes its own coverage JSON, nyc merges automatically. ### CI behavior - **PRs:** Coverage collector skipped (fast CI) - **Master:** Coverage collector runs (full synthetic user validation) Co-authored-by: you <you@example.com> |
||
|
Kpa-clawbotandyou
|
f438411a27 |
chore: remove deprecated Node.js backend (-11,291 lines) (#265)
## Summary Removes all deprecated Node.js backend server code. The Go server (`cmd/server/`) has been the production backend — the Node.js server was kept "just in case" but is no longer needed. ### Removed (19 files, -11,291 lines) **Backend server (6 files):** `server.js`, `db.js`, `decoder.js`, `server-helpers.js`, `packet-store.js`, `iata-coords.js` **Backend tests (9 files):** `test-decoder.js`, `test-decoder-spec.js`, `test-server-helpers.js`, `test-server-routes.js`, `test-packet-store.js`, `test-db.js`, `test-db-migration.js`, `test-regional-filter.js`, `test-regional-integration.js` **Backend tooling (4 files):** `tools/e2e-test.js`, `tools/frontend-test.js`, `benchmark.js`, `benchmark-ab.sh` ### Updated - `AGENTS.md` — Rewritten architecture section for Go, explicit deprecation warnings - `test-all.sh` — Only runs frontend tests - `package.json` — Updated test:unit - `scripts/validate.sh` — Removed Node.js server syntax check - `docker/supervisord.conf` — Points to Go binary ### NOT touched - `public/` (active frontend) ✅ - `test-e2e-playwright.js` (frontend E2E tests) ✅ - Frontend test files (`test-packet-filter.js`, `test-aging.js`, `test-frontend-helpers.js`) ✅ - `package.json` / Playwright deps ✅ ### Follow-up - Server-only npm deps (express, better-sqlite3, mqtt, ws, supertest) can be cleaned from package.json separately - `Dockerfile.node` can be removed separately --------- Co-authored-by: you <you@example.com> |
||
|
|
ec7ae19bb5 |
ci: restructure pipeline — sequential fail-fast, Go server E2E, remove deprecated JS tests (#256)
## Summary Complete CI pipeline restructure. Sequential fail-fast chain, E2E tests against Go server with real staging data, all deprecated Node.js server tests removed. ### Pipeline (PR): 1. **Go unit tests** — fail-fast, coverage + badges 2. **Playwright E2E** — against Go server with fixture DB, frontend coverage, fail-fast on first failure 3. **Docker build** — verify containers build ### Pipeline (master merge): Same chain + deploy to staging + badge publishing ### Removed: - All Node.js server-side unit tests (deprecated JS server) - `npm ci` / `npm run test` steps - JS server coverage collection (`COVERAGE=1 node server.js`) - Changed-files detection logic - Docs-only CI skip logic - Cancel-workflow API hacks ### Added: - `test-fixtures/e2e-fixture.db` — real data from staging (200 nodes, 31 observers, 500 packets) - `scripts/capture-fixture.sh` — refresh fixture from staging API - Go server launches with `-port 13581 -db test-fixtures/e2e-fixture.db -public public-instrumented` --------- Co-authored-by: Kpa-clawbot <kpabap+clawdbot@gmail.com> Co-authored-by: you <you@example.com> |
||
|
you
|
13cab9bede |
perf: optimize frontend coverage collector (~2x faster)
Three optimizations to reduce wall-clock time: 1. Reduce safeClick timeout from 3000ms to 500ms - Elements either exist immediately after navigation or don't exist at all - ~75 safeClick calls; if ~30 miss, saves ~75s of dead wait time 2. Replace 18 page.goto() calls with SPA hash navigation - After initial page load, the SPA shell is already in the DOM - page.goto() reloads the entire page (network round-trip + parse) - Hash navigation via location.hash triggers the SPA router instantly - Only 3 page.goto() remain: initial load + 2 home page loads after localStorage.clear() 3. Remove redundant final route sweep - All 10 routes were already visited during the page-specific sections - The sweep just re-navigated to pages that had already been exercised - Saves ~2s of redundant navigation Also: - Reduce inter-route wait from 200ms to 50ms (SPA router is synchronous) - Merge utility function + packet filter exercises into single evaluate() call - Use navHash() helper for consistent hash navigation with 150ms settle time |
||
|
you
|
12d1174e39 |
perf: speed up frontend coverage tests (~3x faster)
Three optimizations to the CI frontend test pipeline:

1. Run E2E tests and coverage collection concurrently
   - Previously sequential (E2E ~1.5min, then coverage ~5.75min)
   - Now both run in parallel against the same instrumented server
   - Expected savings: ~5 min (coverage runs alongside E2E instead of after)

2. Replace networkidle with domcontentloaded in coverage collector
   - SPA uses hash routing — networkidle waits 500ms for network silence
     on every navigation, adding ~10-15s of dead time across 23 navigations
   - domcontentloaded fires immediately once HTML is parsed; JS initializes
     the route handler synchronously
   - For in-page hash changes, use 200ms setTimeout instead of
     waitForLoadState (which would never re-fire for same-document nav)

3. Extract coverage from E2E tests too
   - E2E tests already exercise the app against the instrumented server
   - Now writes window.__coverage__ to .nyc_output/e2e-coverage.json
   - nyc merges both coverage files for higher total coverage

Also:
- Split Playwright install into browser + deps steps (deps skip if present)
- Replace sleep 5 with health-check poll in quick E2E path
|
||
|
Kpa-clawbotandCopilot
|
72161ba8fe |
perf: replace 169 blind sleeps with Playwright waits in coverage script
Remove all 169 waitForTimeout() calls (totaling 104.1s of blind sleeping)
from scripts/collect-frontend-coverage.js:

- Helper functions (safeClick, safeFill, safeSelect, clickAll, cycleSelect):
  removed 300-400ms waits after every interaction — Playwright's built-in
  actionability checks handle waiting for elements automatically
- Post-navigation waits: removed redundant sleeps after page.goto() calls
  that already use waitUntil: 'networkidle'
- Hash-change navigations: replaced waitForTimeout with
  waitForLoadState('networkidle') for proper SPA route settling
- Toggle/button waits: removed — event handlers execute synchronously
  before click() resolves
- Post-evaluate waits: removed — evaluate() is synchronous

Local benchmark (Windows, sparse test data):
  Before: 744.8s
  After:  484.8s (35% faster, 260s saved)

On CI runner (ARM Linux with real mesh data), savings will be
proportionally better since most elements exist and the 104s
of blind sleeping was the dominant bottleneck.

Co-authored-by: Copilot <223556219+Copilot@users.noreply.github.com>
|
||
|
you
|
9b0c740537 |
revert: aggressive coverage interactions dropped score from 42% to 39%
The page.evaluate() calls corrupting localStorage and firing fake events caused page error-reloads, losing accumulated coverage. Reverting to the 42% version which was the actual high water mark. |
||
|
you
|
556e3b19db |
coverage: aggressive branch coverage push — target 80%+
Add ~900 lines of deep branch-coverage interactions: - Utility functions with all edge cases (timeAgo, truncate, escapeHtml, formatHex, etc.) - roles.js: getHealthThresholds/getNodeStatus for all roles + edge inputs - PacketFilter: compile+match with mock packets, all operators, bad expressions - HopResolver/HopDisplay: init, resolve, renderPath with various inputs - RegionFilter: onChange, getSelected, isEnabled, setRegions, render - Customize: deep tab cycling, import/export, bad JSON, theme preview - WebSocket reconnection trigger - Keyboard shortcuts (Ctrl+K, Meta+K, Escape) - Window resize (mobile/tablet/desktop) for responsive branches - Error routes: nonexistent nodes/packets/observers/channels - localStorage corruption to trigger catch branches - Theme toggling (dark/light rapid switching, custom vars) - Live page: VCR modes, timeline clicks, speed cycling, all toggles - Audio Lab: play/stop/loop, BPM/volume sliders, voice selection - All analytics tabs via deep-link + sort headers - Packets: complex filter expressions, scroll-to-load, double-click - Nodes: special char search, all sort columns, fav stars - Channels: resize handle drag, theme observer, node tooltips - Observers/Observer Detail: sort, tabs, day cycling - Node Analytics: day buttons, tabs - Home: both new/experienced flows, empty search results - debouncedOnWS/onWS/offWS exercise |
||
|
you
|
86dce6f350 |
coverage: massively expand frontend interaction coverage
Exercise every major code path across all frontend files: app.js: all routes, bad routes, hashchange, theme toggle x4, hamburger menu, favorites dropdown, global search, Ctrl+K, apiPerf(), timeAgo/truncate/routeTypeName utils nodes.js: sort every column (both directions), every role tab, every status filter, cycle all Last Heard options, click rows for side pane, navigate to detail page, copy URL, show all paths, node analytics day buttons (1/7/30/365), scroll target packets.js: 12 filter expressions including bad ones, cycle all time windows, group by hash toggle, My Nodes toggle, observer menu, type filter menu, hash input, node filter, observer sort, column toggle menu, hex hash toggle, pause button, resize handle, deep-link to packet hash map.js: all role checkboxes toggle, clusters/heatmap/neighbors/ hash labels toggles, cycle Last Heard, status filter buttons, jump buttons, markers, zoom controls, dark mode tile swap analytics.js: all 9 tabs clicked, deep-link to each tab via URL, observer selector on topology, navigate rows on collisions/ subpaths, sortable headers on nodes tab, region filter customize.js: all 5 tabs, all preset themes, branding text inputs, theme color inputs, node color inputs, type color inputs, reset buttons, home tab fields (hero, journey steps, checklist, links), export tab, reset preview/user theme live.js: VCR pause/speed/missed/prompt buttons, all visualization toggles (heat/ghost/realistic/favorites/matrix/rain), audio toggle + BPM slider, timeline click, resize event channels.js: click rows, navigate to specific channel observers.js: click rows, navigate to detail, cycle days select traces.js: click rows perf.js: refresh + reset buttons home.js: both chooser paths, search + suggest, my-node cards, health/packets buttons, remove buttons, toggle level, timeline Also exercises packet-filter parser and region-filter directly. |
||
|
you
|
26d4bbc39d | ci: fix coverage collector — use Playwright bundled chromium on CI | ||
|
you
|
5ee976055b |
feat(coverage): add targeted Playwright interactions for higher frontend coverage
Add redundant selectors (data-sort, data-role, data-status, data-tab, placeholder-based search, emoji theme toggle, .cust-close, #fTimeWindow, broader preset selectors) to exercise more frontend code paths. All interactions wrapped in try/catch for resilience. |
