mirror of
https://github.com/Kpa-clawbot/meshcore-analyzer.git
synced 2026-11-11 12:18:47 +00:00
417c8dd00a243f29822f34e5c9aaadbd2e522213
2
Commits
| Author | SHA1 | Message | Date | |
|---|---|---|---|---|
 efitenandClaude Opus 5.5 |
3960fadd96 |
fix(pages): drop late responses that belong to an earlier page visit (#2218, #2230, #2200) (#2248)
Fixes #2218, fixes #2230, fixes #2200. Node analytics, the account page and analytics await their data, then write into the shared `#app` container. A response that lands after the user has navigated away replaces the new page. In #2218's reproduction, the Nodes list, with 200 rows, became an Analytics heading. ## The shared part `public/app.js` keeps one view generation, `viewGeneration()`: - `navigate()` bumps it before the old page's `destroy()`, so every page init counts as a new visit, including a switch to another node of the same page type. - A page captures the value at init, and after each `await` drops the result when the value has moved on. `.eslintrc.json` declares it as a global. ## Per page **#2218, `node-analytics.js`** - `loadAnalytics` and `loadBatteryChart` check the generation on both success and error. A page-local `loadSeq` makes a time-range click a new load on the same visit, so an older range can't land over a newer one. - `NodeHopAnalytics.load` already checked `container.isConnected`, so it is unchanged. **#2230, `account.js`** - The render after `CSAuth.ready()` runs only while the generation is unchanged. - `destroy()` was empty. It now clears `shown.app` and `shown.userId`. **#2200, `analytics.js`** - A page-local `_loadSeq` sits next to the generation. Results and errors of an older window/region selection or an earlier visit are dropped, so a late failure of an old load no longer shows an error over newer results. - The bulk load renders only the six tabs drawn from its data. A tab that loads its own data (Prefix Tool, Nodes, Roles, ...) is no longer rebuilt or replaced by the bulk result: a deep-linked one renders at init, and a window, region or area change re-renders it directly. - `renderTab` guards the six tabs drawn from the bulk data (overview, rf, topology, channels, hashsizes, collisions). Until the data arrives they show "Loading analytics…", or the current load's error. Overview no longer dereferences an undefined `rf`. - Three related fixes in the same lines: - The error message is now escaped with `esc()`; it was inserted raw. - `destroy()` removes the RegionFilter and AreaFilter listeners. They piled up on every visit and called `loadAnalytics` from other pages. - `destroy()` resets the stored error. ## Tests | File | Assertions | Covers | |---|---|---| | `tests/unit/test-issue-2218-node-analytics-stale-render.js` | 12 | Loads the real router: the generation rises on every init, including another node. Late success and error after leaving, a stale visit of the same node, an older range landing last, late battery success and error. The current response, battery and error still render | | `tests/unit/test-issue-2230-account-stale-render.js` | 6 | Leaving before ready (login view and "not enabled"), re-entering before ready, the current render, an auth change after `destroy()` | | `tests/unit/test-issue-2200-analytics-stale-load.js` | 19 | An older selection landing last, a late rejection of an older selection, leave and re-enter (success and error), the current error rendered escaped and kept on a tab click, Overview and RF clicked before the data | | `tests/e2e/test-issue-2218-node-analytics-stale-e2e.js` | 4 steps | Holds `/api/nodes/*/analytics` with `page.route`, returns to `#/nodes`, then releases the response as a 200 and as a 500. The 200 rows stay and no Analytics heading appears; a normal visit still renders | How I checked them: - With the production files reverted and the tests kept, 7 of 12, 4 of 6 and 7 of 12 unit assertions fail. With the fix, all pass. - The E2E fails on the unfixed frontend with "Nodes rows 200 before release, 0 after". - Single mutations, each reverted: - removing the success check in `loadAnalytics` (analytics) fails 2 assertions; - removing the check after `CSAuth.ready()` fails 3. Other test changes: - `test-analytics-theme-refresh-before-data.js` and `test-user-management-ui.js` get a `viewGeneration: () => 0` stub. - The new E2E is registered in `scripts/non-unit-tests.json` and `deploy.yml` (shard 2, next to the #748 suite). The unit tests are in `test-all.sh`. - The broad suite's "Node side panel Details link navigates" test selected an anchor that now opens Analytics, as #2218 notes. It now clicks `#nodesRight .node-detail-btn`. Results: - `sh test-all.sh` passes, and `npx eslint public/*.js` reports 0 errors. - E2E on a fixture seeded as in CI: | Suite | Result | |---|---| | `test-e2e-playwright.js` | 148 passed, 3 skipped | | `test-user-management-e2e.js` | 28/28 | | the new #2218 suite | 4/4 | | `test-issue-748-node-analytics-coverage-e2e.js` | 2/2 | | `test-analytics-fluid-charts.js` | 8/8 | | `test-issue-1657-analytics-channels-group-sprites-e2e.js` | 5/5 | ## Not done - Two tabs that each fetch their own data can still overwrite each other after a fast tab switch between them. #2200 does not ask for that. - `nodes.js` `navigateToNode` calls its own `init` without the router, so it does not bump the generation. None of the three pages fixed here depends on that. - I placed the E2E in shard 2 without measuring suite times, which the `deploy.yml` comment asks for. --------- Co-authored-by: Claude Opus 5.5 <noreply@anthropic.com> |
||
|
Alex BandClaude Opus 5.5
|
8b5ca5735c |
fix(analytics): Packets / Hour readable on long histories (#2193) (#2194)
Fixes #2193. ## Problem On an instance that keeps months of packets, the Overview tab's Packets / Hour chart becomes unreadable: 2,932 hourly bars in 720 units of plot, a date label every day, and the hours with no packets (which the server leaves out) squeezed off the axis. ## Before and after Both use the real `/api/analytics/rf` answer from the instance in the issue (2,933 hourly buckets over 124 days), served to the page in place of the fixture's own. **Before** (master, page on "All data"): 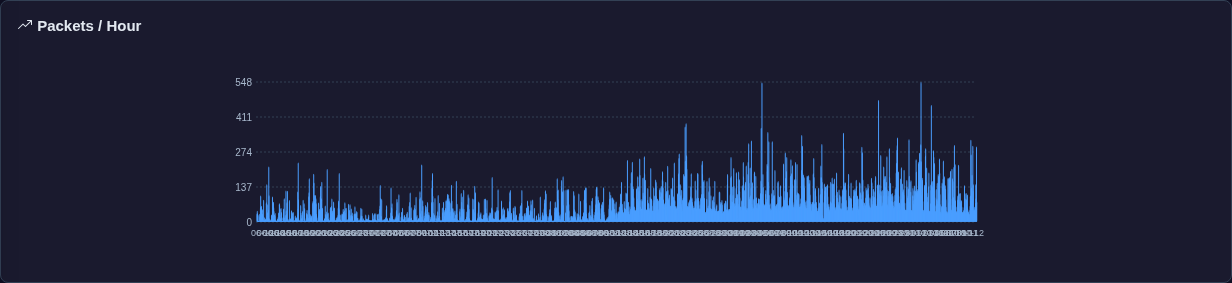 **After**, same data: 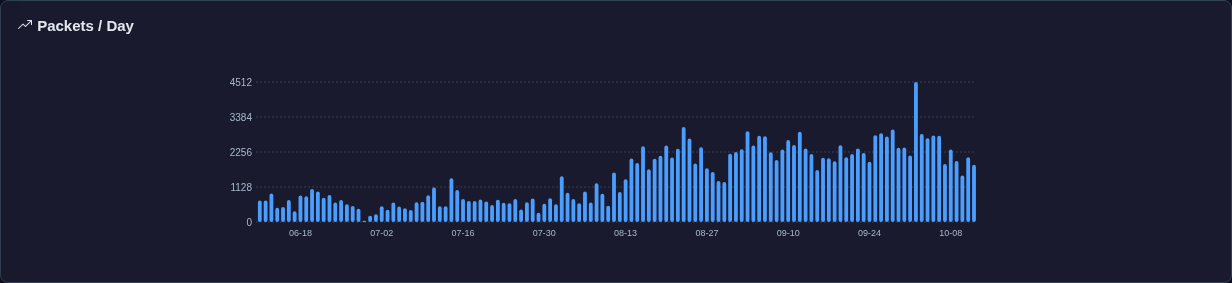 Phone: <img src="https://raw.githubusercontent.com/A13xB0/CoreScope/7862abd8/2026-10/pph-2193/after-phone.png" width="300"> **A short store** (an instance holding 7 days in memory, plus a few old packets a day for weeks before that because they were heard again). The chart starts where the real data does (this shot predates the "since MM-DD" note now in the title when that crop applies): 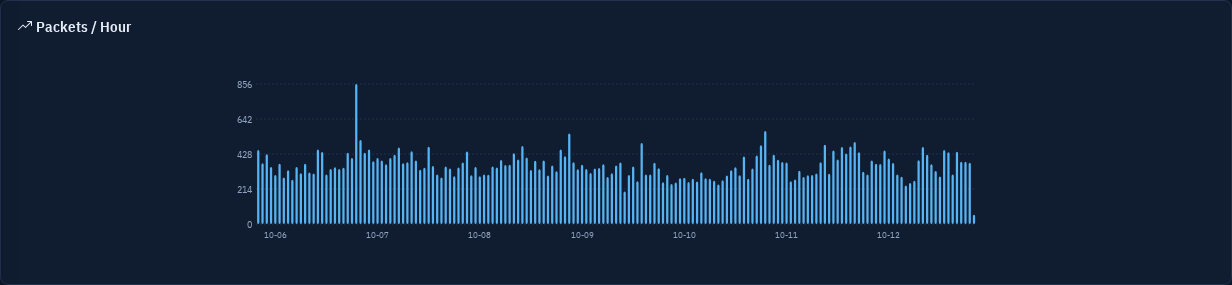 ## Change All in `public/analytics.js`; no API change. - **`packetsPerHourCard()`** replaces the inline block: - rolls the hours up to hourly, 6-hourly, daily or weekly bars, at most 180, and titles the card to match (Packets / Day); - counts missing hours as zero; - puts about 10 labels on round UTC times; - **under "All data" only**, starts on the first UTC day with at least 2% of a typical recent day (the median of the seven days before the last one), at its first hour with a tenth of a typical hour, and says "since MM-DD" in the title when that cuts anything. Scanning forward, an outage after the start is never taken for it. In a picked window (1h to 30d) the server has already cut the data, so nothing is cropped and a quieter early stretch stays visible. - **Theme refresh before the data** (separate commit; this also happens on master without the new chart): every load fires `theme-refresh` about 300 ms after the theme resolves, and the page re-rendered the current tab on it. When the analytics answers came later (a busy or just-restarted server), the Overview was drawn from an empty object and threw `Cannot read properties of undefined (reading 'totalTransmissions')`. It now skips that refresh until the data has landed; `loadAnalytics()` renders the tab with the current theme when it does. The span is still picked by the page's time window. ## Tests - `tests/unit/test-issue-2193-packets-per-hour.js` (in `test-all.sh`, red then green): 122 days gives 123 daily bars with 4 to 12 labels; 7 days gives 168 hourly bars; missing hours are drawn as zero; the chart starts at the data, not at the stragglers, and not after an outage; in a picked window nothing is cropped (90 days with 30 quiet ones gives 91 bars); a cropped chart says "since MM-DD" and an uncropped one does not; no data says so. - `tests/unit/test-analytics-theme-refresh-before-data.js` (in `test-all.sh`): drives `init()` with answers that never land, fires the `theme-refresh` handler, and checks that nothing throws and the tab is not re-rendered. Without the guard it fails with the production error. - `sh test-all.sh` passes; the #1925 neighbour-graph theme-refresh test and the analytics chart test still pass; the screenshots show no page errors and no sideways scroll at 1280 px or 390 px. ## Later - The 2% floor, the tenth-of-an-hour start and the 180-bar cap are hardcoded. Per AGENTS.md rule 8 they can move to the customizer in a later step. - Edge bars are partial periods (data starting at 17h gives a 7-hour first day; the last bar is still filling), and weekly bars align on epoch weeks (Thursday). Both are left as they are here. 🤖 Generated with [Claude Code](https://claude.com/claude-code) https://claude.ai/code/session_01KaR4xu8gVykQBkH8yG8m6H --------- Co-authored-by: Claude Opus 5.5 <noreply@anthropic.com> |