mirror of
https://github.com/Kpa-clawbot/meshcore-analyzer.git
synced 2026-10-12 10:57:17 +00:00
4e91c5cf0bb2e35e12a074580f4d993c32cb6f00
425
Commits
| Author | SHA1 | Message | Date | |
|---|---|---|---|---|
 Alex BandClaude Opus 5.5 Alex BandClaude Opus 5.5
|
4e91c5cf0b |
perf(analytics): opt-in pauseWhenIdle skips recomputes nobody reads (#2164)
## Summary The analytics recomputers (#1240) recompute eleven snapshots (topology, RF, distance, channels, hash collisions, hash sizes, roles, two clock-skew views, retransmissions, direct-heard) on a fixed interval, 300 s by default, whether or not anyone reads them. That is the right trade for a busy instance: reads always hit a warm cache. On a quiet one it means most of the server's allocation goes on results nobody looks at. Measured on one production instance (2 vCPU / 2 GB): - topology, RF and hash-sizes were each **read 23 times in 45 hours** while being recomputed every 5 minutes; - `analyticsRecomputer.runOnce` accounted for **30% of all bytes allocated** (121 GB of 391 GB in 45 h); - garbage collection was 87% of the process's CPU (30 s CPU profile: `gcDrain` 39.9 s of 45.9 s sampled), with an 805 MB live heap against a 1 GiB `GOMEMLIMIT`, so allocation rate translates directly into collector time. This PR adds an **opt-in** `analytics.pauseWhenIdle`: - a recomputer's tick is skipped when nothing has read its snapshot since the previous compute, and the recomputer is marked paused; - the next read still returns immediately with the snapshot it holds (`Load` stays non-blocking, as #1240 requires), and makes a non-blocking send that wakes the loop to recompute; reads after that get the fresh snapshot and the ticker resumes from there. **Default is off**, so behaviour is unchanged unless an operator turns it on. The trade-off for operators who do: the first read after a quiet spell can show a snapshot older than the interval (refreshed seconds later). It is documented in `config.example.json`. No existing issue covers this. ## Config example Off by default. To turn it on, add one key to the existing `analytics` block in `config.json`: ```json "analytics": { "defaultIntervalSeconds": 300, "pauseWhenIdle": true } ``` Nothing else changes: per-endpoint `recomputeIntervalSeconds` still apply while an endpoint is being read. There is no UI change, so no screenshot. ## Performance Staging A/B: the same 30 minutes of real production API traffic (5,640 requests from a day's nginx log, replayed at 2x against a copy of the production database with the live MQTT feed), on `master` and on this branch with `pauseWhenIdle: true`, each after a restart and warm-up. Allocation is the delta of `/debug/pprof/allocs` across the replay: | during the replay | master | this PR | |---|---|---| | allocated by `analyticsRecomputer.runOnce` | 459.7 MB | **53.4 MB (-88%)** | | total allocated by the process | 3,704 MB | 3,372 MB (-9%) | | GC cycles | 52 | 41 | | requests: p50 / p95 / errors | 9.9 ms / 57.0 ms / 0 | 10.4 ms / 60.1 ms / 0 | The replayed traffic included real analytics reads, so the paused recomputers were woken by them; the remaining 53 MB is that. Over 15 minutes each recomputer only ticks about three times, so on a longer quiet period the saving grows with the idle time. GC count and CPU on this shared host vary between runs on their own, so the allocation figures are the claim, not the GC count. There is no Go benchmark for this change: the behaviour is "how many computes happen in a period of no reads", which the tests below assert directly (16 computes on master vs at most 2 here over the same idle period). ## Tests - Red commit `24056c57`: config field, accessor stub and an unused recomputer flag, plus tests. Three fail on the stub: - `TestAnalyticsRecomputer_PauseWhenIdleSkipsUnreadTicks`: an unread recomputer with a 20 ms interval computes at most twice in 300 ms (16 times on the stub); - `TestConfig_AnalyticsPauseWhenIdle`: `pauseWhenIdle: true` enables it, absent or nil config leaves it off; - `TestStartAnalyticsRecomputers_AppliesPauseWhenIdle`: all eleven recomputers receive the flag. - Also added, passing on both commits on purpose: a read on a paused recomputer returns the existing snapshot and triggers a refresh; a recomputer that is being read keeps ticking; the default (off) keeps ticking unread. - Green commit `19de3636`: the behaviour, `config.example.json` entry with `_comment_pauseWhenIdle`, and the `Load` doc comment. - `go test -race` on the recomputer, warm-up (#1659) and config tests, three runs: pass. `make test`: 16 of 16 modules pass. The frontend tests that read `config.example.json` pass. ## Review notes - `roles` reads the nodes-clock-skew snapshot inside its own compute, which counts as a read, so that dependency keeps its source fresh while roles is in use. - The #1659 warm-up gate is untouched: a skipped tick never marks a first pass done. - Config documented per WORKFLOW.md section 7. Customizer (AGENTS.md rule 8): it is an operator setting, not a display value; no customizer entry proposed. ## SonarLint SonarQube Community rules (the SonarLint engine) were run on the files this PR touches, and only issues on lines it adds are listed. - No issues on the added lines. ## Checked against the repo rules - Rebased onto `master` (`673442cc`). Each red commit was re-run and still fails on its assertions; each green commit passes (TDD.md). - `make test`: all 16 modules pass. Frontend suites: all pass except `test-issue-1956-release-routing.js`, which needs CI's `GITHUB_REF_NAME` and fails the same way on `master` locally (#2160 addresses it). - No private data: test fixtures and examples use the codes the existing tests use (SJC/SFO/LAX, `#be`-style scopes). - No new `map[string]interface{}`, no hard-coded colours. `git add` was explicit, and there is one logical change per commit. 🤖 Generated with [Claude Code](https://claude.com/claude-code) https://claude.ai/code/session_01KaR4xu8gVykQBkH8yG8m6H --------- Co-authored-by: Claude Opus 5.5 <noreply@anthropic.com> |
||
|
Alex BandClaude Opus 5.5
|
352a0ccd19 |
feat(region-filter): configurable region quick picks (#2170)
## Summary **Independent of every other open PR.** Choosing a pick saves the selection, redraws the control and notifies the page's listeners itself, exactly as a click in the control does, so it re-queries straight away whether or not #2168 (`setSelected` notifies) is merged; with both in, nothing fires twice. Region quick picks are named groups of region (IATA) codes, offered as one-tap choices inside the region filter, e.g. "Northern California" for a dozen airport codes instead of ticking each box. One deployment has been injecting these into the page through an nginx `sub_filter` and a script that wraps `window.RegionFilter`; this makes them a configured feature. ```jsonc "regionQuickPicks": [ { "name": "Northern California", "description": "Bay Area and Sacramento observers.", "regions": ["SJC", "SFO", "OAK", "SMF"] } ] ``` - **Server:** `GET /api/config/region-quick-picks` returns the groups cleaned up: names and codes trimmed, codes upper-cased and de-duplicated in their configured order, groups without a name or codes dropped, at most 20 groups of 200 codes, always a list. `/api/config/regions` is unchanged. - **Region filter:** loads the groups with the regions and offers every group with at least one observer today, inside the region control: - dropdown layout: rows of the same kind as **All** (checkbox and bold name), directly under All with a divider before the single regions; the row is ticked while that pick is the selection, ticking it selects the pick and closes the menu, unticking goes back to all; - pill layout: the picks lead the same bar, set off from the single regions by a thin divider. - A tap selects the group's codes that have an observer and re-queries straight away. - The selector then reads the group's name ("South Bay ▾") instead of "2 Regions", and the button shows as pressed. Selecting the same codes by hand does the same. - Tapping the active group again goes back to all regions. - A failed fetch, or no configured groups, leaves the filter exactly as before. - **Mobile:** the rows take the menu's 44 px row height under `(pointer: coarse)`; the pill-bar picks reuse `.region-pill` and its touch target. Inside `.filter-bar` (Packets) the existing touch rule for inputs made every region checkbox a 44 px square; the checkbox is now 20 px and the 44 px row is the tap target. - **Semantics:** like every region filter, a group means "heard by observers in these regions", not "located there"; `config.example.json` says so. No existing issue covers this. ## Screenshot Nodes page with two picks configured (example config below), after tapping **South Bay**: the pick and its codes (SJC, MRY) are selected, and the list re-queried for them. Taken against `test-fixtures/e2e-fixture.db`. 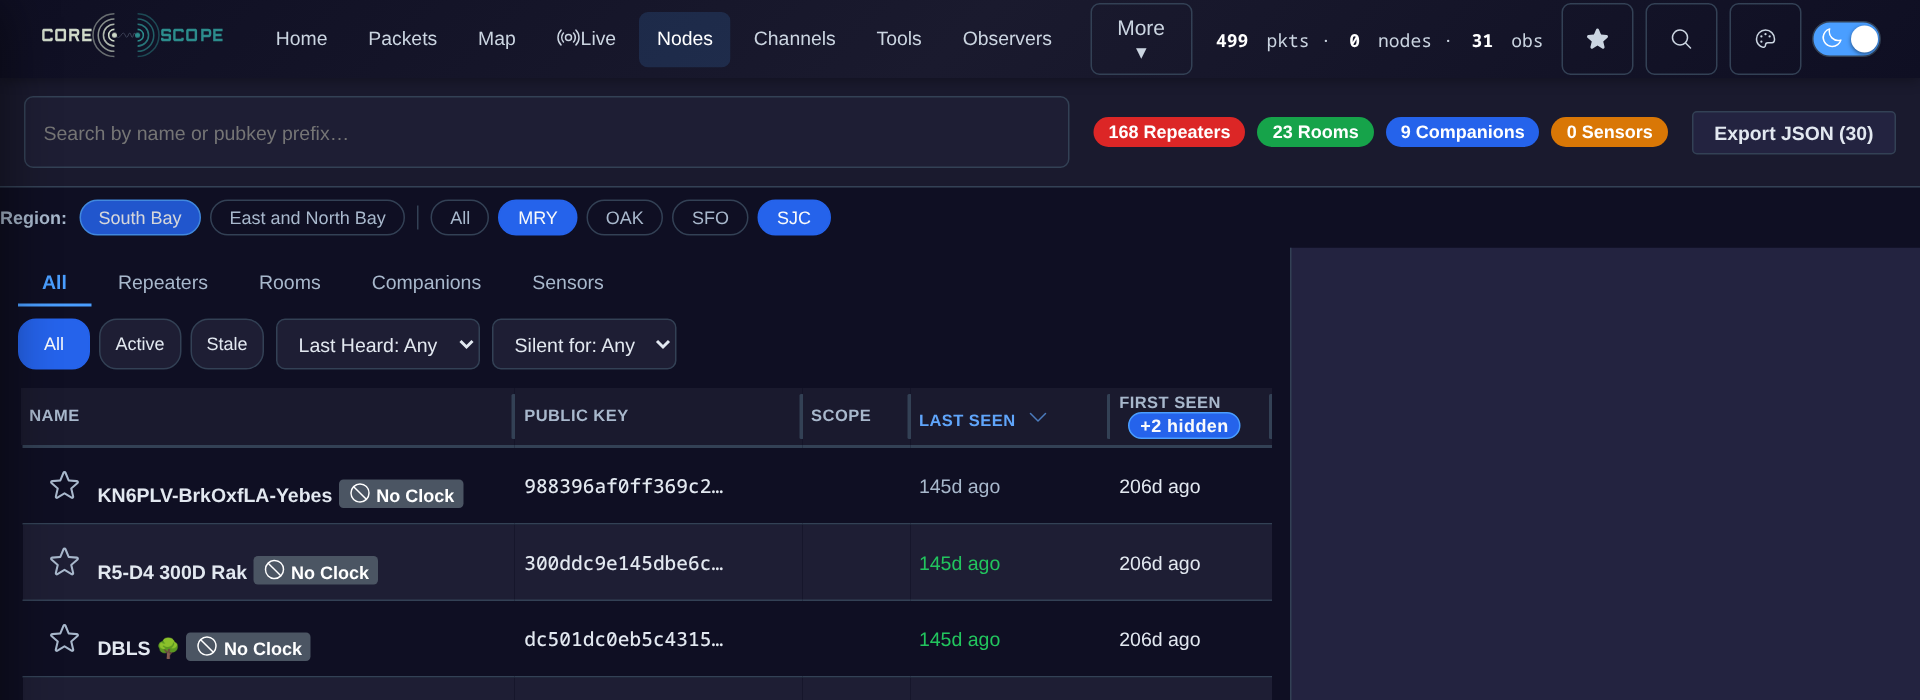 ## Config example ```json "regionQuickPicks": [ { "name": "South Bay", "description": "San Jose and Monterey observers", "regions": ["SJC", "MRY"] }, { "name": "East and North Bay", "description": "Oakland and San Francisco observers", "regions": ["OAK", "SFO"] } ] ``` Each pick needs a `name` and at least one code; `description` is optional (shown as the tooltip). Codes are trimmed, upper-cased and de-duplicated; a pick with no code that has an observer today is not shown. At most 20 picks of 200 codes. ## Browser validation The branch's server was run locally against a migrated copy of `test-fixtures/e2e-fixture.db` (observers in MRY, OAK, SFO, SJC) with three groups configured: "South Bay" (SJC, MRY, SCZ), "East and North Bay" (OAK, SFO, sts) and "Nowhere yet" (XXX). Checked in headless Chromium: | check | desktop 1280 px | phone 390 px (touch) | |---|---|---| | groups shown | South Bay, East and North Bay ("Nowhere yet" hidden) | same | | tap South Bay selects | SJC, MRY (SCZ has no observer) | same | | next `/api/packets` request | `region=SJC,MRY` | `region=SJC,MRY` | | selector label | "South Bay ▾" | "South Bay ▾" | | second tap | back to all regions | same | | button height | 24 px | 44 px | | page wider than viewport | no | no | | page errors | none | none | Checked on Packets (dropdown layout) and Nodes (pill layout). Three layout problems found this way on the phone were fixed before opening: a sideways-scrolling row clipped at the screen edge, the selector squeezed into a narrow column (the filter group is a non-wrapping flex row), and the two wrapped rows spread apart on Nodes (`align-content`). **Revision 1:** the first version put the picks in a separate row beside the selector; they moved inside the dropdown. Re-checked with a 14-region list and three picks on Packets: desktop 1280 px dark and phone 390 px light both keep the menu on screen (menu 340 px wide, page not wider than the viewport), the pick closes the menu and the trigger names the pick. **Revision 2:** picks are checkbox rows like **All** instead of chips. Re-checked on Packets at 1280 px dark and 390 px light: rows render bold under All, the divider separates the single regions, ticking a pick ticks its codes and names the trigger, no sideways scroll. Unrelated and not changed: on Nodes at 390 px the region row (existing pills included) starts flush with the screen edge. ## Tests - Red commit `81ea67d6`: the config type, a stub normaliser and endpoint returning nothing, and tests. - Go: cleaning (trim, upper-case, de-duplicate, drop incomplete groups), caps, nil config, and the endpoint's JSON. - Frontend, `tests/e2e/test-region-quick-picks.js` (moved from `tests/unit/` in `fced69a7`; it needs jsdom, so it runs in the E2E job like `test-table-sort.js`): the real `region-filter.js` in **jsdom** against faked config endpoints. Nine cases: rendering and hiding groups with no observer, selecting and re-querying, the selector label, toggling back, a hand-made selection marked active, the pill layout, no groups, a failed fetch, HTML escaping. Seven fail on the stub, all on assertions. - Green commit `0e33210e`: the implementation, styles, `config.example.json` (`regionQuickPicks` + `_comment_regionQuickPicks`), `docs/api-spec.md`, and the OpenAPI route list (`TestOpenAPICompleteness` requires it). The jsdom test also had a cross-realm comparison bug fixed in this commit (`Array.from` on arrays coming out of the jsdom window). - `make test`: 16 of 16 modules pass. Frontend suites: 195 of 196; the one failure, `test-issue-1956-release-routing.js`, needs CI's `GITHUB_REF_NAME` and fails the same way on `master` locally. - Red commit `f991060d` (revision): picks live inside the dropdown menu before the checkboxes, choosing one closes the menu, and in the pill layout they share the region bar; two fail on assertions against the old layout. Green commit `1f720e35`. Frontend 195 of 196 (same environment-only failure). - Red `134f5256` / green `da0adb50` (second revision): picks are checkbox rows between All and the single regions with a divider, no chips in the menu; ticking and unticking a pick row. The green commit also repairs `style.css`: `1f720e35` had prepended its block to the top of the file (its edit matched an earlier `.region-pill {`) and left the previous rules in place. The file now differs from `master` by 13 lines. ## Review notes - Groups are offered only when at least one of their codes appears in `/api/config/regions`, and only those codes are selected. The stored selection is pruned to known codes on load anyway, so selecting absent codes would not survive a reload. - Customizer (AGENTS.md rule 8): groups are operator configuration; a customizer editor could come later. ## SonarLint SonarQube Community rules (the SonarLint engine) were run on the files this PR touches, and only issues on lines it adds are listed. - **Fixed** in `b84ace4e`: - `normalizeQuickPickCodes` split out of the config normaliser (S3776, 17 > 15); - a comment on why a failed quick-pick fetch is ignored (S2486); - `for…of` in `activePick` (S4138); - in the tests: `node:` specifiers, `includes()`, and an explicit string comparator for sorted selections (S7772, S7765, S2871). - **Kept on purpose:** - S2486 is still reported on that `catch`. Swallowing the error is the intended behaviour: the filter works as before, just without picks. - S1523 on the `vm` test loader, as above. ## Checked against the repo rules - Rebased onto `master` (`673442cc`). Each red commit was re-run and still fails on its assertions; each green commit passes (TDD.md). - `make test`: all 16 modules pass. Frontend suites: all pass except `test-issue-1956-release-routing.js`, which needs CI's `GITHUB_REF_NAME` and fails the same way on `master` locally (#2160 addresses it). - No private data: test fixtures and examples use the codes the existing tests use (SJC/SFO/LAX, `#be`-style scopes). - No new `map[string]interface{}`, no hard-coded colours. `git add` was explicit, and there is one logical change per commit. 🤖 Generated with [Claude Code](https://claude.com/claude-code) https://claude.ai/code/session_01KaR4xu8gVykQBkH8yG8m6H --------- Co-authored-by: Claude Opus 5.5 <noreply@anthropic.com> |
||
|
Alex BandClaude Opus 5.5
|
696906315a |
feat(scope-audit): transport view of every repeater seen forwarding (#2142, API) (#2167)
## Summary Backend half of #2142 (the page is the stacked PR #2169). `GET /api/scope-audit` lists only repeaters that have answered a declared-regions request: 17 of almost 200 nodes on the instance the request came from. This adds a transport view, `GET /api/scope-audit?mode=transport&window=…[&scope=X]`, with one row per repeater **seen forwarding** in the window: - `transported`: the named region scopes it was seen carrying, each with packets and first/last seen (most packets first), plus unscoped, unmatched and ambiguous-hop counts; - `asked`, `declaredRegions`, `notObserved`, `configState`, `declaredAt` where a declared answer exists; `asked: false` with null declared fields where it does not ("not asked" is not "declares nothing"); - with `scope=X` (spelled `be`, `#be` or `BE`): `carriesScope` on every row and `carrying` / `notCarrying` counts, which is the rollout report the issue asks for. `mode=declared` (or no `mode`) is unchanged. An unknown `mode` is a 400. Partial fix for #2142: this PR provides the API; the page is #2169 and the observer region filter #2171. The issue should only be considered done once all three are in. ## How it follows the issue's notes - **The scan does not change.** It is the same single `ScopeAuditForwarding` pass, with every repeater and room in `nodes` (plus any declared target) as a target instead of only the declared ones. Same attribution rules: FLOOD-family route types only, `minForwarderHopHexLen` (no 1-byte hops), and a hop whose prefix matches more than one repeater is credited to none of them. - **Identity lookup with 1,000+ pubkeys:** `scopeAuditNodeIdentities` runs one `IN` query; exercised at 1,200 keys in the benchmark below. - **Row count and response size:** measured below. - **Cache:** the transport view is cached per window with the declared view's TTLs (30 s; 5 min for 7d), under the same singleflight group with a `transport|` key. The scope filter is applied to a copy of the cached result, so one scan serves every scope. (`scope=`, not `region=`: across the API `region=` is the observer IATA filter.) - **Wording:** "transported" is documented as *seen carrying*, not configured for; the declared side stays separate. ## Performance `BenchmarkComputeScopeTransport`: 1,200 repeaters (#1975 quotes an instance with 1,179), 30k flood transmissions in the last 24h on 4-hop paths of 3-byte prefixes, a third region-scoped: ``` BenchmarkComputeScopeTransport-12 5 219253727 ns/op 425.4 response-KB 1200 rows ``` 219 ms per compute, served from cache for 30 s (24h) or 5 min (7d); a 425 KB uncompressed response for 1,200 rows. This is new code with no "before"; the declared view's numbers are untouched (same scan, same cache). ### On real data (a staging copy of a production database and its live feed) | request | rows | result | time | |---|---|---|---| | declared view, 24h | 16 | (unchanged) | | | `mode=transport`, 24h | **385** repeaters seen forwarding, 16 of them with a declared answer | | 1.5 s cold | | `mode=transport&scope=<scope A>`, 7d | 664 | **51 carrying it, 613 not** | 14.4 s cold | | `mode=transport&scope=%23<SCOPE B>` (`#` and capitals), 7d, same window now cached | 664 | 237 carrying, 427 not | 0.35 s | The 7d cold compute is the same full-window hop scan the declared view already pays for 7d (its own TTL comment measures 16.7 s on a live-shaped database); like the declared view it is then cached for 5 minutes, and every scope filter is served from that one scan. - Commit `ceaeb56b` renamed the filter from `region=` to `scope=` after opening; the real-data figures above were taken before the rename and are otherwise the same code. ## Tests - Red commit `2a9b1286`: response types and a `mode=transport` stub that returns no rows, plus tests. Four fail on the stub: - repeaters that never answered are listed with `asked: false` and null declared fields (and the answered one with its declared list and `notObserved`); - `scope=fr` / `%23fr` / `FR` marks carriers and non-carriers and counts them; no scope means no `carriesScope` or counts; - an unknown mode is a 400; - the transport and declared views are cached separately (requesting one does not serve the other). - Also added, passing on the stub by construction: a repeater with no traffic in the window is not listed; the node blacklist applies. - Green commit `60c669f4`: the implementation, `docs/api-spec.md` (new `mode` and `scope` parameters, a Transport view section with the response shape), and the benchmark. - `make test`: 16 of 16 modules pass, including every existing scope-audit test. ## Review notes - Hidden-name and blacklist filtering use the same rules as the declared view. - `newTestStoreWithDB` now takes `testing.TB` so the benchmark can use it (callers unchanged). - No new `map[string]interface{}`; the response is a named struct. - No config added. ## SonarLint SonarQube Community rules (the SonarLint engine) were run on the files this PR touches, and only issues on lines it adds are listed. - **Fixed** in `060668b6`: S3776 (cognitive complexity 41 > 15) in the new `computeScopeTransport`. It is split into target, visibility, row and sort helpers; the response is the same and the transport tests are unchanged. ## Checked against the repo rules - Rebased onto `master` (`673442cc`). Each red commit was re-run and still fails on its assertions; each green commit passes (TDD.md). - `make test`: all 16 modules pass. Frontend suites: all pass except `test-issue-1956-release-routing.js`, which needs CI's `GITHUB_REF_NAME` and fails the same way on `master` locally (#2160 addresses it). - No private data: test fixtures and examples use the codes the existing tests use (SJC/SFO/LAX, `#be`-style scopes). - No new `map[string]interface{}`, no hard-coded colours. `git add` was explicit, and there is one logical change per commit. 🤖 Generated with [Claude Code](https://claude.com/claude-code) https://claude.ai/code/session_01KaR4xu8gVykQBkH8yG8m6H --------- Co-authored-by: Claude Opus 5.5 <noreply@anthropic.com> |
||
|
Alex BandClaude Opus 5.5
|
8a3b923e81 |
perf(scope-stats): keep the per-region count on the first_seen index (#2166)
## Summary `/api/scope-stats` averaged **2.6 s on one production instance (max 17.7 s)**, whatever the window. Four of its five queries take 10-100 ms on that database. The fifth, the per-region count, took **2.5-2.9 s for every window, 1h included**: SQLite chose `idx_tx_scope_name` (`scope_name > ''`) and walked every scoped transmission ever stored (45 days of them), filtering by `first_seen` afterwards. ``` SEARCH transmissions USING INDEX idx_tx_scope_name (scope_name>?) | USE TEMP B-TREE FOR ORDER BY ``` A unary `+` on every `scope_name` reference in that query (`WHERE … +scope_name …`, `GROUP BY +scope_name`) stops the planner using that index. The query then searches the window on `idx_transmissions_first_seen` and groups in a temp b-tree, the same idiom the `advertsByRole` query in the same function already uses for `payload_type`. Putting `+` in the `WHERE` alone is not enough: the planner then walks `idx_tx_scope_name` to avoid sorting for the `GROUP BY`, which is just as slow; the `GROUP BY +scope_name` is what fixes it. ``` SEARCH transmissions USING INDEX idx_transmissions_first_seen (first_seen>?) | USE TEMP B-TREE FOR GROUP BY | USE TEMP B-TREE FOR ORDER BY ``` Related to #2146, which lists `/api/scope-stats` (2.3 s average on one instance) and records the 24 h summary as 7 ms warm there. On the instance measured here the per-region query planned onto `idx_tx_scope_name` and took 2.5-2.9 s for every window; this PR fixes that plan. Not marked as a fix: #2146 is about pool and lock waits. ## Results are identical On a copy of the production database, the old and new query run inside **one read transaction** (same snapshot) return exactly the same rows for 1h, 24h, 7d and 45d (5, 10, 12 and 18 regions; 73, 2,024, 13,822 and 76,083 transmissions). `TestScopeStatsByRegion_CountsMatchWindow` also checks the per-region counts against a direct count of the window. ## Performance ### The query alone, on a copy of the production database 311k transmissions, 76k of them region-scoped over 45 days; best of three: | window | before | after | |---|---|---| | 1h | 2,530 ms | 0.1 ms | | 24h | 2,570 ms | 11.6 ms | | 7d | 2,876 ms | 124 ms | ### The endpoint, on staging Cold `GET /api/scope-stats` (the response cache is 30 s, so each sample is a full compute) on a staging host with a copy of a production database and its live feed; two samples each, 32 s apart: | window | master | this PR | |---|---|---| | 1h | 3.08 s, 2.83 s | **16 ms, 12 ms** | | 24h | 2.69 s, 2.79 s | **131 ms, 101 ms** | | 7d | 3.35 s, 4.53 s | **626 ms, 663 ms** | ### Go benchmark `BenchmarkGetScopeStats24h`: all five scope-stats queries for 24h, on 300k transmissions spread over 45 days (a quarter region-scoped), with production's tables and both competing indexes and `ANALYZE` run as production does (#2072). 10 runs: ``` cpu: AMD Ryzen 5 3600XT 6-Core Processor │ master │ this PR │ GetScopeStats24h-12 33.186m ± 3% 8.058m ± 6% -75.72% (p=0.000 n=10) ``` The fixture is smaller and better cached than production, which is why the absolute times are lower than above; the plan change is the same. ## Tests - Red commit `a7dcf98f`: moves the query into `scopeStatsByRegionQuery` (unchanged), adds the fixture, the benchmark, `TestScopeStatsByRegion_UsesFirstSeenIndex` (`EXPLAIN QUERY PLAN` must use `idx_transmissions_first_seen` and not `idx_tx_scope_name`; fails on `master` with exactly the production plan shown above) and `TestScopeStatsByRegion_CountsMatchWindow` (passes on both commits; guards correctness). - Green commit `f9ba986b`: the `+` hints and a comment explaining them. - All existing scope-stats tests pass; `make test`: 16 of 16 modules pass. ## Review notes - Only the per-region query changes; the summary, non-transport, time-series and adverts-by-role queries already search by `first_seen`. - If `idx_transmissions_first_seen` were ever missing, the query would still run correctly (full scan); `+` only removes `idx_tx_scope_name` from consideration, unlike `INDEXED BY`, which would make the query fail. - `/api/scope-stats` still has no singleflight around its 30 s cache (unlike stats, channels and the scope audit). With the query now well under a second it matters much less; left for a separate change. ## SonarLint SonarQube Community rules (the SonarLint engine) were run on the files this PR touches, and only issues on lines it adds are listed. - No issues on the added lines. ## Checked against the repo rules - Rebased onto `master` (`673442cc`). Each red commit was re-run and still fails on its assertions; each green commit passes (TDD.md). - `make test`: all 16 modules pass. Frontend suites: all pass except `test-issue-1956-release-routing.js`, which needs CI's `GITHUB_REF_NAME` and fails the same way on `master` locally (#2160 addresses it). - No private data: test fixtures and examples use the codes the existing tests use (SJC/SFO/LAX, `#be`-style scopes). - No new `map[string]interface{}`, no hard-coded colours. `git add` was explicit, and there is one logical change per commit. 🤖 Generated with [Claude Code](https://claude.com/claude-code) https://claude.ai/code/session_01KaR4xu8gVykQBkH8yG8m6H --------- Co-authored-by: Claude Opus 5.5 <noreply@anthropic.com> |
||
|
Alex BandClaude Opus 5.5
|
95672ac2be |
perf(server): share /api/nodes responses for identical queries for 15 s (#2165)
## Summary

`/api/nodes` scans every node row into a map, enriches it (hash size,
multi-byte capability, relay info, usefulness scores, declared scope)
and encodes the page on **every** request. On one production instance (2
vCPU / 2 GB) that was **95 GB of allocation in 45 hours, about 6.7 MB
per request and a quarter of all bytes allocated**, on a process where
garbage collection was 87% of CPU.

The queries repeat heavily. In that instance's nginx log for one day,
three pages of one query (`limit=500&offset=0|500|1000&lastHeard=30d`)
were 10,000 of the 14,053 `/api/nodes` requests.

This PR keeps the encoded response for 15 s per distinct query:

- `handleNodes` serves the cached bytes when it can; otherwise it builds
through `buildNodesResponse` (the old handler body, unchanged apart from
returning instead of writing) inside a singleflight, so concurrent
identical misses share one build.
- **Cache key:** blacklist generation | hidden-prefix generation |
sorted query string. Parameter order does not split the cache, and any
change to either filter list misses it at once. This is the pattern
`/api/nodes/{pubkey}/reach` already uses (#1629).
- `setGeoFilter` drops the cache, so a geo-filter change through the
admin endpoint shows immediately.
- **Bounded twice:** by `maxCacheEntries` (256) like the other keyed
caches, and by bytes, since a full-list response is several MB. Expired
entries are dropped on every insert, the total is capped at 32 MB, and a
single response over 8 MB is not cached.
- **15 s** matches the relay/usefulness caches the response is built
from (#1257); the client already keeps its own node list for 90 s.

Related to #2146: `/api/nodes` is in its endpoint table (144 s max on
one instance). This PR reduces how often the handler runs and allocates,
not the SQL wait the issue is about, so it is not a fix for it.

## Performance

### Go benchmarks

1,100 nodes, half repeaters, 10 runs each:

```
cpu: AMD Ryzen 5 3600XT 6-Core Processor
                       │    master     │              this PR                 │
                       │    sec/op     │    sec/op     vs base                │
HandleNodesRepeated-12   5991.14µ ± 3%    41.21µ ± 7%  -99.31% (p=0.000 n=10)
HandleNodesUnique-12       6.010m ± 2%    5.967m ± 0%        ~ (p=0.393 n=10)

                       │     B/op      │     B/op      vs base                │
HandleNodesRepeated-12   1611.0Ki ± 1%   240.9Ki ± 0%  -85.05% (p=0.000 n=10)
HandleNodesUnique-12      1.566Mi ± 1%   1.753Mi ± 1%  +11.96% (p=0.000 n=10)
```

`Repeated` is one query asked over and over (the production pattern).
`Unique` makes every request a different query, so nothing is served
from cache: the time is unchanged, and it allocates 12% more because the
body is now built in memory so it can be kept.

### Expected hit rate

Replaying that day's 14,053 `/api/nodes` requests through a cache of
each lifetime:

| TTL | served from cache |
|---|---|
| 5 s | 39% |
| 10 s | 47% |
| **15 s** | **52%** |
| 30 s | 58% |
| 60 s | 69% |

### Staging A/B

The same 30 minutes of real production API traffic (5,640 requests, 279
of them `/api/nodes`), replayed at 2x on a staging host against a copy
of a production database, on `master` and on this branch:

| `/api/nodes` | master | this PR |
|---|---|---|
| p50 | 47.1 ms | **31.0 ms** |
| p95 | 165.4 ms | **114.4 ms** |
| max | 759.9 ms | 321.7 ms |
| allocated by `handleNodes` during the replay | 1,000 MB | **594 MB
(-41%)** |
| total allocated by the process | 3,704 MB | 3,349 MB (-10%) |

The -41% matches the expectation from the hit rate and the miss-path
cost: about 0.48 × 1.12 + 0.52 × 0.15 ≈ 0.61 of the old allocation.

## Tests

- Red commit `ab33bc29`: a test-only build hook, the tests and both
benchmarks. Three fail on `master`: identical queries are built once,
reordered parameters share an entry, ten concurrent misses share one
build. Three more guard against over-caching and pass on both commits:
different queries are built separately, an expired entry is rebuilt, a
geo-filter change drops entries.
- Green commit `ea0d1cf2`: the cache, plus
`TestHandleNodes_FilterListChangesMissCache` (hidden-prefix and
blacklist changes miss the cache) and `TestNodesCache_BoundedByBytes`
(stays under 32 MB; an oversized response is not cached).
- One existing test changed: `TestHandleNodesRegionUsesStore` already
clears the store's own 30 s region cache by hand before its second
request; it now clears this cache on the same line.
`TestHiddenNamePrefix_1181_NodesList`, which changes the hidden-prefix
list between requests, passes unchanged because the generation is in the
key.
- `go test -race` on the new tests passes. `make test`: 16 of 16 modules
pass.

## Review notes

- The response depends only on the query string and server state, not on
who is asking (no auth or header-dependent output in the handler), so a
shared cache is safe.
- `writeJSONBytes` writes the cached bytes with the same `Content-Type`
and status as `writeJSON`; the body has the trailing newline
`json.Encoder` adds, so output is byte-identical.
- No new `map[string]interface{}` added (the existing node maps are
unchanged; converting them to a struct is a separate, larger job).
- The TTL and byte budget are constants. They could be operator settings
later (AGENTS.md rule 8); not added here.

## SonarLint

SonarQube Community rules (the SonarLint engine) were run on the files
this PR touches, and only issues on lines it adds are listed.

- **S3776 on `buildNodesResponse`:** complexity 91. That is upstream's
existing handler body moved unchanged (it is also 91 on `master`); this
PR makes the handler itself simpler.
- **Fixed** in `25d40950`: the test hook moved to the cache-miss path,
so the builder stays identical to the old body rather than one point
above it. Splitting that function is a refactor of its own.

## Checked against the repo rules

- Rebased onto `master` (`673442cc`). Each red commit was re-run and
still fails on its assertions; each green commit passes (TDD.md).
- `make test`: all 16 modules pass. Frontend suites: all pass except
`test-issue-1956-release-routing.js`, which needs CI's `GITHUB_REF_NAME`
and fails the same way on `master` locally (#2160 addresses it).
- No private data: test fixtures and examples use the codes the existing
tests use (SJC/SFO/LAX, `#be`-style scopes).
- No new `map[string]interface{}`, no hard-coded colours. `git add` was
explicit, and there is one logical change per commit.

🤖 Generated with [Claude Code](https://claude.com/claude-code)

https://claude.ai/code/session_01KaR4xu8gVykQBkH8yG8m6H

---------

Co-authored-by: Claude Opus 5.5 <noreply@anthropic.com>
|
||
|
Alex BandClaude Opus 5.5
|
be6aeffe45 |
perf(store): drop the duplicate subpath count map (#2163)
## Summary

The subpath index keeps every contiguous run of 2-8 hops from every
stored transmission's path, in two maps:

- `spIndex`: key → count
- `spTxIndex`: key → transmissions containing that subpath, one entry
per occurrence

Both were always updated together (the only production callers were
`addTxToSubpathIndexFull` / `removeTxFromSubpathIndexFull`, which touch
both), so every count equalled `len(spTxIndex[key])`. The existing
`TestSubpathTxIndexPopulated` asserted exactly that. The index therefore
held its 1M+ keys twice.

This PR removes `spIndex`. The two analytics consumers read `len(txs)`,
and the add/remove helpers take only the transaction map. No API
response changes.

No existing upstream issue covers this; it came out of profiling a
production instance where garbage collection was 87% of CPU (30 s CPU
profile: `gcDrain` 39.9 s of 45.9 s sampled) with an 805 MB live heap
against a 1 GiB `GOMEMLIMIT`. That heap profile put 186 MB in this
index; on that instance's 7-day window there are 1.2M distinct subpath
keys (79% seen once) and 3.07M entries.

## Performance

### Go benchmark

`BenchmarkBuildSubpathIndex` builds the index for a synthetic,
production-shaped window: 41k transmissions with path lengths drawn from
the production hop-count histogram, and hops from random walks over a
400-node graph with 3-byte prefixes. That gives 1.48M keys, 85% seen
once (production: 1.2M, 79%). No real data is used. 10 runs each:

```
cpu: AMD Ryzen 5 3600XT 6-Core Processor
                     │    master    │              this PR               │
                     │    sec/op    │   sec/op     vs base               │
BuildSubpathIndex-12    2.157 ± 1%    1.610 ± 5%  -25.33% (p=0.000 n=10)

                     │  retained-B  │  retained-B   vs base              │
BuildSubpathIndex-12   238.5Mi ± 0%   187.7Mi ± 0%  -21.31% (p=0.000 n=10)

                     │     B/op     │     B/op      vs base              │
BuildSubpathIndex-12   572.0Mi ± 0%   465.6Mi ± 0%  -18.61% (p=0.000 n=10)
```

(`retained-B` is the live heap the index keeps after a forced GC: 250.1
MB → 196.8 MB.)

### Staging heap

Live heap after a forced GC (`/debug/pprof/heap?gc=1`), on a staging
host running a copy of a production database and its live MQTT feed,
attributed to the subpath index builder:

| | master | this PR |
|---|---|---|
| subpath index (`buildSubpathIndex`, cum) | 172.4 MB | 116.1 MB |
| packets in memory at the time | 27,521 | 24,086 |
| per packet | 6.27 KB | 4.82 KB (**-23%**) |

The two snapshots were taken minutes apart with different numbers of
packets loaded, hence the per-packet figure; it agrees with the
benchmark's -21%.

The same A/B replay used for the other PRs (30 minutes of real
production API traffic) showed no latency change (p50 10.3 ms vs 10.7
ms, p95 59.5 ms vs 52.9 ms, 0 errors). GC count and CPU were lower in
this run (44 → 28 collections, 13.0% → 9.6% CPU), but runs on this
shared host vary by that much on their own, so no claim is made from
them.

## Tests

- Red commit `ded359ff`: the fixture, `TestSubpathFixtureShape` (keeps
the fixture production-like: 60-95% singleton keys),
`BenchmarkBuildSubpathIndex`, and `TestSubpathIndexRetainedHeap`, which
allows at most 225 MB for the 41k fixture. It fails on `master` with
250.1 MB.
- Green commit `e399c561`: the change. The heap test passes at about 197
MB.
- `make test`: 16 of 16 modules pass; `go test -race` over the subpath,
eviction, path-hop and resolved-index tests passes.

Test changes in the green commit are mechanical, as required for a
structural change:

- struct literals stop setting `spIndex`; where a literal did not set
`spTxIndex` it now does, because appending to a nil map panics where the
old code skipped the transaction map when passed `nil`;
- count assertions read `len(spTxIndex[key])`;
- the old "spIndex and spTxIndex agree" check becomes "no key is kept
with an empty list", which is what keeps `len()` a correct count.

## Review notes

- Removal still takes out one occurrence per subpath occurrence and
deletes a key whose list becomes empty, so `len()` stays equal to the
old count through eviction.
- The store's memory estimate (`perSubpathEntryBytes`) is unchanged
here; accounting accuracy is a separate item.
- No new `map[string]interface{}`.

## SonarLint

SonarQube Community rules (the SonarLint engine) were run on the files
this PR touches, and only issues on lines it adds are listed.

- **Fixed** in `8af9582f`: S3776 (cognitive complexity 16 > 15) in the
test fixture. Path generation is split into graph and hop-count helpers;
the random draws stay in the same order, so the fixture is unchanged.

## Checked against the repo rules

- Rebased onto `master` (`673442cc`). Each red commit was re-run and
still fails on its assertions; each green commit passes (TDD.md).
- `make test`: all 16 modules pass. Frontend suites: all pass except
`test-issue-1956-release-routing.js`, which needs CI's `GITHUB_REF_NAME`
and fails the same way on `master` locally (#2160 addresses it).
- No private data: test fixtures and examples use the codes the existing
tests use (SJC/SFO/LAX, `#be`-style scopes).
- No new `map[string]interface{}`, no hard-coded colours. `git add` was
explicit, and there is one logical change per commit.

🤖 Generated with [Claude Code](https://claude.com/claude-code)

https://claude.ai/code/session_01KaR4xu8gVykQBkH8yG8m6H

---------

Co-authored-by: Claude Opus 5.5 <noreply@anthropic.com>
|
||
|
n30nex
|
a5b60ca594 |
test: make local validation independent of runner environment (#2160)
Fixes #2159. Related to #1995. Standalone release tests failed when `GITHUB_REF_NAME` was absent and could use an unrelated runner tag when it was present. Supply the simulated tag explicitly; exercise the real release-notes step with both missing and unrelated host values, including present and absent notes files. Two filesystem fixtures now report unsupported Windows capabilities explicitly: POSIX permission bits, and symlink creation denied with error 1314. Unix mode checks and all symlink safety assertions remain intact; other symlink setup errors still fail. Production code and workflows are unchanged. This is 29 added lines across three test files. Validation: reproduced all three failures before fixing them; focused regressions, the full standalone frontend suite, and native Go server/ingestor suites pass. The POSIX permission and unprivileged Windows symlink fixtures are explicitly skipped on this host and remain enabled in Linux CI. The browser smoke suite passed 148 checks, with three fixture-dependent skips and two pre-existing disabled cases. No configuration or customizer changes. |
||
|
efitenandClaude Opus 5.5
|
0737f10a5d |
feat(notify): optional external node alerts feed and the node.external event (#2177) (#2178)
Closes #2177. ## What Node notifications can mail alerts computed outside CoreScope. With `userManagement.notifications.externalAlerts` configured, users can choose a new event, `node.external`, which is off by default and only offered when configured: ```json "notifications": { "enabled": true, "externalAlerts": { "url": "http://coverage-job/alerts.json", "maxAgeHours": 48, "label": "Coverage" } } ``` The feed: ```json { "generatedAt": "2026-10-11T01:35:12Z", "alerts": [ { "pubkey": "<64 hex>", "key": "SE", "text": "never heard to the south-east", "url": "https://example.org/coverage" } ] } ``` Mail lines: `<name>: Coverage: never heard to the south-east, <time>` when an alert appears, `<name>: Coverage resolved (SE), <time>` when it is gone from a fresh feed. ## How - `cmd/server/notify_external.go`: feed types, `parseExternalFeed` (RFC 3339 `generatedAt`, age check, per-alert validation), `fetchExternalFeed` (200 only, 1 MB cap, 10 s timeout). - `notify_eval.go`: `evalExternal`. Subjects are `<pubkey>/<key>`; a `<pubkey>/*` row is the per-node baseline, so the first fresh feed after watching stores the current alerts without a mail (like `foreign.new`), and later alerts mail at once. `External == nil` (not configured, nobody chose it, or stale) leaves every `node.external` state as it is. - `notify_service.go`: the feed is fetched only when configured and at least one user chose the event. Each new reason the feed is unusable is logged once, and so is the recovery. Mail text and link: the alert's `url`, otherwise the node page. - `notify_handlers.go`: `availableEvents` and the new `externalLabel` include the event only when configured; PUT answers 400 for `node.external` otherwise. - `internal/users/notify.go`: event constant, `OptionalNodeNotifyEvents` (canonical order: node, optional, admin), `RemoveWatch` also deletes the node's `<pubkey>/...` rows. - Account page label, OpenAPI descriptions, `config.example.json` comment, `docs/user-guide/accounts.md` section. Decisions on the three open questions in #2177: the generic name `node.external`; the resolved mail names the key instead of repeating the text, so there is **no `users.db` schema change** (a bump would also make older binaries refuse the file); one feed. ## Invariants - Read/write separation (#1283): the server only reads the feed over HTTP. State rows go to `users.db` through `internal/users`, like the other events. - A dead, garbled or old feed never mails "resolved": `TestEvaluateExternalStaleFeedChangesNothing` and `TestNotifierMailsExternalAlertsAndSkipsAStaleFeed` (HTTP 502 and a 72 h old feed in a row, then a fresh empty feed resolves). ## Performance The evaluator adds one pass over the stored states (already read every tick) plus, per user with the event on and per watched node, the node's current alerts. Bounded by `maxWatchesPerUser` (50) times the alerts per node. The feed is fetched once per tick (default 5 minutes) only when someone chose the event, capped at 1 MB. No packet-store lock is taken for it. Nothing changes for instances without `externalAlerts`. ## Tests - `cmd/server`: `go test` green locally (Windows; `TestSaveGeoFilterPreservesFileMode` skipped as it needs Unix mode bits). New: `notify_external_test.go` (feed parsing and limits, HTTP fetch 200/404/oversized, config resolution, evaluator baseline/new/resolved/returning/stale/not chosen/notifications off, notifier end to end with a fake feed, account routes). - `internal/users`: green, 2 new tests (optional event and canonical order, `RemoveWatch` deletes external subjects only for that node). - Frontend: `test-all.sh` green, 1 new test in `test-notifications-ui.js` (label from `externalLabel`, escaped). - `scripts/check-xss-sinks.sh --file public/notifications.js`: clean. ## Not done - No E2E test: the account page change is one label, covered by the unit test. - Not run against a live instance yet. The first feed in use is the coverage job of on8ar.eu (`alerts.json`, 29 alerts at the moment). Co-authored-by: Claude Opus 5.5 <noreply@anthropic.com> |
||
|
efitenandClaude Opus 5.5
|
b2cda21a27 |
feat(server): companion linking routes, device tokens and bearer auth (#2175)
Part 2 of 3 for #2173 (companion linking): the server routes, bearer auth and the link handshake. Builds on #2174 (merged); `upstream/master` is merged in, so the diff shows only this part. Everything here is behind `userManagement.enabled` and answers 404 with it off. ## Changes in this PR **Device tokens and bearer auth** - `POST /api/auth/device-token`: email + password returns a bearer token, stored as a `kind = 'device'` session with a label. Same failure answers and the same rate limit as login. - Server-enforced scope for a bearer token: `/api/auth/me`, `/api/auth/logout`, `/api/account/companions*`, `/api/account/settings`. Everything else answers 403. - A bearer header only counts when there is no session cookie, so an auth proxy that adds its own `Authorization` header does not hide a logged-in browser. Cookies never accept a device token. - The sessions list on the account API carries `kind` and `label`; logout with a bearer token revokes that device. **Linking a companion** - `POST /api/account/companions/challenge` `{pubkey}` returns `{challenge, expiresAt, host}`: 32 random bytes, single use, 5 minutes, bound to the caller and the pubkey. - `POST /api/account/companions` `{pubkey, challenge, signature, name}`: the signature is the companion's Ed25519 signature over `corescope-link:<host>:<challenge>` (`internal/sigvalidate.VerifyMessage`). The challenge is consumed in every case. - A companion linked to another account moves to the caller (the newest proof wins). Both users get a `companion.transfer` audit row and the previous owner a mail. That mail is a security notice: it is sent whatever the node notification settings are. - `GET /api/account/companions` (with `lastSeenAt` from `client_receptions`) and `DELETE /api/account/companions/{pubkey}`. - Linking does not touch the synced `meshcore-my-nodes`: a companion is not a node to monitor. - Admin user detail lists linked companions; the account data export includes companions and device sessions. **Coverage and config** - `GET /api/rx-coverage?mine=1`: only coverage of the caller's linked companions (401 when logged out, 403 for a device token). With `gaps=1` (#2172) the reply carries no `gaps` member under `mine=1`, because the track query takes one companion and cannot narrow to a set yet (`TestRxCoverageMineOmitsGaps`). - `clientRxCoverage.requireLinkedCompanion` (default off) is read and reported in `/api/config/client`, which also announces `userManagement.companionLinking`, so CoreDrive RX shows its login only where linking exists. The ingestor side is part 3. - CORS: for origins in `corsAllowedOrigins`, the device-token routes alone also allow POST/PUT/DELETE and the `Authorization` and `Content-Type` headers. No credentialed CORS. Documented in `config.example.json`. - OpenAPI and `docs/api-spec.md` cover the new routes. ## Verification - 26 new tests in `cmd/server` and `internal/sigvalidate`, among them: `TestCompanionLinkFlow`, `TestCompanionLinkRejections` (signature by another key, malformed signature, challenge bound to another pubkey, unknown challenge; reuse and expiry are covered by the store tests in #2174), `TestCompanionTransfer`, `TestCompanionTransferMailIgnoresNotificationSettings`, `TestBearerScopedRoutes`, `TestBearerIgnoredWithCookie`, `TestDeviceTokenSharesLoginRateLimit`, `TestCORSBearerRoutes`, `TestCompanionRoutesAbsentWhenOff`, `TestRxCoverageMine`, `TestRxCoverageMineOmitsGaps` (fails without the `mine == nil` guard), `TestVerifyMessage`. - `cmd/server`, `internal/sigvalidate` and `internal/users`: `go vet` and `go test ./...` green, `gofmt` clean. - The linking flow runs on analyzer.on8ar.eu since 9 October 2026 with CoreDrive RX v1.19.0 (a real companion linked through the signed challenge). ## Not in this PR - The ingestor's linked-only filter, the account page (Devices, Companions), the "My coverage" toggle and the user docs: part 3. - Per-user broker credentials and per-user API keys (non-goals in the spec). --------- Co-authored-by: Claude Opus 5.5 (1M context) <noreply@anthropic.com> |
||
|
efitenandClaude Opus 5.5
|
9897d52cf6 |
feat(users): companion linking store (schema v6, device sessions, link challenges) (#2174)
Part 1 of 3 for #2173 (companion linking). This PR adds only the `users.db` side: the schema and store methods the server (part 2) and ingestor (part 3) build on. No route, no UI and no behaviour change for a running server. ## Changes in this PR - **Design spec** `docs/specs/2026-10-08-companion-linking-design.md`, including the optional linked-only ingest. - **Schema v6** (`internal/users/schema.go`): - `sessions` gains `kind` (`'web'` or `'device'`), `label` and `scopes` (`''` = full, for web sessions). - `companion_links (pubkey PRIMARY KEY, user_id, name, linked_at)`, cascading on user delete. - `link_challenges`: single-use challenges bound to a user and a pubkey, with an expiry. - **Device sessions** (`sessions.go`): create a device session with a label and scopes, list sessions with kind and label. - **Challenges** (`challenges.go`): issue and consume a challenge exactly once; consumed, expired, or bound to another user or pubkey all fail. - **Companion links** (`companions.go`): link, list, unlink. Linking a pubkey that belongs to another user moves it and reports the previous owner (transfer detection), so the server can audit and mail. - **Janitor**: the existing janitor also prunes expired challenges (`cmd/server/auth_service.go`, 3 lines). ## Upgrade note The store migrates `users.db` to v6 on start. A binary that only knows v5 refuses to open a v6 file (`users: database schema version 6 is newer than this binary supports (5)`), so rolling back after this lands needs the pre-upgrade `users.db` backup. ## Verification - `internal/users`: new tests for the v6 migration from v5, device sessions, challenges (single use, expiry, binding) and companion links (transfer, cascade on user delete). `go vet` and `go test ./...` green. - `cmd/server` full suite green against the v6 store. ## Not in this PR - Routes, bearer auth and the link handshake: part 2. - Ingestor filter, account page and "My coverage": part 3. --------- Co-authored-by: Claude Opus 5.5 (1M context) <noreply@anthropic.com> |
||
|
efitenandClaude Opus 5.5
|
f3004d977e |
feat(rx-coverage): show where a companion drove and received nothing (#2172)
The Mobile RX coverage page (`#/rx-coverage`) shows only cells where a companion received something. Where a companion drove and received nothing is just as useful for operators, and the data is already there: the RF sample track (`client_rf_samples`, #1905/#1906) and the receptions (`client_receptions`) use the same hex grid (`hexCellAt`, `zoomToHexRes`). This PR adds those cells as a hatched layer under the reception cells. ## Changes in this PR **Server** - `GET /api/rx-coverage?...&gaps=1` adds a `gaps` member to the FeatureCollection: cells with moving (non-stationary) track samples and no reception in the same `days` window and `bbox`, each with `samples`. `gaps_truncated` is set when more than 5000 cells qualify (the most-sampled are kept, same pattern as `coverageFeatureCap` and `rfNoiseFeatureCap`). - Gaps are only returned when `clientRfSamples` is on and there is no `node` filter: with `?node=` the question would be "this node was not heard", which these cells do not answer. `?rx=` limits both the track and the receptions to that companion. - Without `gaps=1` the payload is unchanged: the `gaps` member is omitted. - New code lives in `cmd/server/rx_coverage_gaps.go` (pure `aggregateGaps` plus `queryTrackPoints`); the handler change in `rx_dashboard.go` is 14 lines. - `/api/rx-coverage` is now documented in `openapi.go` and removed from `openapi_known_gaps.json` (#1670). **Frontend** (`public/rx-coverage.js`, `public/node-reach-coverage.css`) - A "Nothing received" toggle on the signal layer, on by default, only rendered with `MC_CLIENT_RF_SAMPLES`. Hidden on the noise layer. - Gap cells use a 45-degree hatch (an SVG pattern in a dedicated renderer, so they sit under the reception cells). The hatch is denser for cells driven through more often (1 / 2-3 / 4+ samples). Tooltip: sample count. Legend entry: "driven, nothing received". - Off state is deep-linkable as `gaps=0`. - New token `--nq-cov-gap` for light and dark. Plain grey (`--nq-cov-grey`) already means "received, no SNR", so the hatch keeps the two apart. ## Threshold: one sample Measured on a live network (analyzer.on8ar.eu, Belgium, September to October 2026), with cells of about 250 m: a cell with track samples and no reception in one half of a month, driven again in the other half. How often did it receive something the second time? | Minimum samples | Cells "nothing received" | Driven again | Received something later | |---|---|---|---| | 1 | 3971 | 1263 | 29% | | 2 | 1565 | 592 | 32% | | 3 | 619 | 243 | 35% | | 5 | 142 | 63 | 40% | A higher threshold hides cells without making the rest more reliable, so the threshold is 1 and the wording is "nothing received in this period", never "no coverage". Using every decoded packet as reception evidence (including 1-byte path hashes) gave 25% to 32%, so the capture rule for 1-byte hashes is not what drives this. The median cell has 2 samples. ## Verification - Go: 7 new tests in `rx_coverage_gaps_test.go` (gap/no gap, stationary excluded, single sample, cap keeps the most-sampled, endpoint, `?rx=` filter, no `gaps` member when not asked / with `?node=` / with RF samples off). The endpoint tests fail without the handler change. Full `cmd/server` suite green locally, `go vet` and `gofmt` clean. - E2E: `tests/e2e/test-rx-coverage-gaps-e2e.js` (4 steps: no toggle with RF samples off, on by default with hatched cells under the reception cells, toggle off with `gaps=0` and deep link, noise layer hides it). 2 steps fail without the frontend change. Existing `test-rx-coverage-noise-e2e.js` and `test-rx-coverage-viewport-e2e.js` still pass. Listed in `scripts/non-unit-tests.json`. - Frontend unit suite (`test-all.sh`) green. - Real data on a staging instance (7 days, bbox 50.8,4.9,51.3,5.8, z=12): 478 reception cells and 379 gap cells, no cell in both, reception features identical with and without `gaps=1`, 0.48 s to 0.52 s per request both ways. - Browser: checked on staging with real data (light theme), and light, dark and 390 px wide with mocked data. ## Not in this PR - A per-node variant on the Reach page ("this repeater transmitted while a companion was nearby, and was not heard"). That needs the transmit moments from `observations` and is a heavier query. - `deploy.yml` does not get a line for the new E2E file, like the other entries that are only in `non-unit-tests.json` (#2037). Co-authored-by: Claude Opus 5.5 <noreply@anthropic.com> |
||
|
efitenandClaude Opus 5.5
|
a2b5a4931e |
perf(server): battery history via the primary key, cached /api/perf row counts (#2156)
Refs #2146 (items: `/api/nodes/:pubkey/battery`, `/api/perf`). ## Situation Two endpoints ran SQL that reads more than it needs, on every request. Timings are read-only on a production database (18.3M observations, 283k `observer_metrics` rows), first run / second run: | Query | Now | With this PR | |---|---|---| | battery history, `WHERE LOWER(observer_id) = ?` | 174 / 29 ms (plan: `idx_observer_metrics_timestamp`) | 5.9 / 5.5 ms (plan: primary key `(observer_id, timestamp)`) | | `/api/perf`: `SELECT COUNT(*) FROM observations` | 118 / 116 ms on every call | once per 60 s | ## My changes in this PR 1. **Battery history** (`5bdd3c7f`). `LOWER(observer_id) = ?` keeps SQLite off the primary-key index, so it walked the timestamp index over every observer's metrics in the window. The query now matches `observer_id IN (?, ?)` with the pubkey lowercased and uppercased, the two casings observer IDs are stored in. 2. **`/api/perf` row counts** (`e24c24cf`). The four `COUNT(*)` (transmissions, observations, nodes, observers) are cached for 60 s. File, WAL and freelist sizes are still read on every call. ## Tests - `TestNodeBatteryQueryUsesObserverIndex` loads the `sqlite_stat1` values of that database and checks the plan uses `sqlite_autoindex_observer_metrics_1`. With the `LOWER()` form it fails with `SEARCH observer_metrics USING INDEX idx_observer_metrics_timestamp (timestamp>?)`. - `TestGetNodeBatteryHistory_LowercaseStoredID`: a lowercase-stored observer ID is still found. - `TestGetDBSizeStatsTypedCachesRowCounts`: the cached count is served within the TTL and refreshed after it. - `cmd/server`: `go test ./...` green. ## Not in this PR Other per-request queries listed in #2146 measured too small to change on the same database: `COUNT(*) FROM dropped_packets` 0.0 ms, `SELECT DISTINCT iata FROM observers` 0.2 ms, the observers packet-count query 1.3 ms, the 7-day active node count 0.1 ms. An observer ID stored in mixed case would no longer match the battery query; in that database all 41 distinct `observer_metrics.observer_id` values are uppercase. --------- Co-authored-by: Claude Opus 5.5 <noreply@anthropic.com> |
||
|
efitenandClaude Opus 5.5
|
be9f382526 |
perf(server): /paths reads canonical paths in batches and skips redundant collision checks (#2157)
Refs #2146 (item: `/api/nodes/:pubkey/paths`). ## Situation Per-step timing in a staging build (3 most-connected nodes, 2 calls each) showed where a `/paths` request spends its time: | Step | Time | |---|---| | build candidates under the read lock | 73-115 ms | | collision check: one `INSTR(LOWER(resolved_path), ?)` query per index hit, 13,367-16,790 per call | 1.3-2.7 s (first call after start: 13.5 s) | | canonical resolved_path per survivor (`bestResolvedPath`, one or two queries each) | 1.7-2.9 s | | aggregation under the read lock | 82-120 ms | So 3.2-4.1 s of a 3.4-5.1 s request was SQL. On a production database (busiest node, 27k transmissions, read-only): the collision check costs 1.85 s one by one and still 1.69 s batched, because SQLite reads and lowercases every stored path either way. Reading the canonical path (the longest observation's stored path) costs 0.18 s one by one and 0.09 s batched by id. ## My changes in this PR - **The collision check runs only where it decides something.** The aggregation keeps a transmission with a canonical path only if that path names the node (`if !containsTarget { continue }`). If no stored path names the node, the canonical one does not either. So for index hits with a canonical path the check changes nothing, and it now runs only for index hits without one, as before. - **Canonical paths are read in batches.** `loadCanonicalResolvedPaths` reads the stored path of each candidate's longest observation, one query per 500 transmissions. When that path is missing, empty or unparseable it calls `bestResolvedPath` for that transmission, so the result is the same as before. - The snapshot of observation IDs and `path_json` strings is taken in the existing candidate read lock (string copies, no parsing). The PR has two commits: a first version that batched both queries and did not get faster on staging, and the change described above, whose message has the measurements. Squash-merging is fine. ## Measurements Staging, after the ingestor's startup `ANALYZE`, same probe for both builds (ms): | | without this PR | with this PR | |---|---|---| | node 1 (degree 55), call 1 / call 2 | 22,237 / 3,364 | 1,793 / 1,686 | | node 2 (degree 47) | 4,427 / 3,615 | 1,828 / 1,809 | | node 3 (degree 46) | 5,171 / 4,035 | 3,050 / 2,408 | | 4 concurrent clients over 40 nodes, 120 s: calls / p50 / p95 | 73 / 6,717 / 15,160 | 125 / 2,861 / 10,630 | Both staging builds also contain #2147 and #2155. ## Tests - `TestLoadCanonicalResolvedPathsMatchesBestResolvedPath` compares the batched result with `bestResolvedPath` on seven cases: the #810 case (longest observation without a stored path), equal lengths, an empty stored path, case, an observation missing from the snapshot, longest wins, nothing stored. - `TestLoadCanonicalResolvedPathsBatchesQueries`: 1,001 transmissions take 3 batched queries and no per-transmission lookups. - `TestHandleNodePaths_CanonicalPathDecidesIndexHits`: the longest observation names A, a shorter one names B; both are index hits. A gets the transmission, B does not, with no per-transmission query. Run against master, the A/B results are the same and only the query-count check fails (1 there, 0 here). - The existing `/paths` tests pass unchanged (#810, #1278, #1352 collision and fallback cases, anchor bias). - `cmd/server`: `go test ./...` and `go test -race` green. ## Not in this PR - `nodeInResolvedPathViaIndex` still calls the per-transmission check; it has no production caller, only tests. - The concurrent p95 is still 10.6 s on staging. What is left there is the 4-connection read pool shared with other endpoints; a staging A/B with 8 connections gave no gain (`/paths` throughput dropped from 133-146 to 81-103 calls per 120 s), so the pool stays at 4. --------- Co-authored-by: Claude Opus 5.5 <noreply@anthropic.com> |
||
|
efitenandClaude Opus 5.5
|
3e21b179ec |
fix(server): drive the reach scan from the observations time window (#2155)
Refs #2146 (item: `/api/nodes/:pubkey/reach`). ## Situation The reach scan joins `observations` to `transmissions` and filters on `o.timestamp >= ?` plus one `o.path_json LIKE '%"XX"%'` per token. With the planner statistics `ANALYZE` produces on a large database, SQLite runs it as `SCAN t`: every transmission, with an index probe into `observations` (`idx_observations_tx_ts`) per row. The cost is then the size of `transmissions`, whatever node is asked for and whatever the window. ## My change in this PR `scanReachRows` uses `CROSS JOIN` for the transmissions join. In SQLite that fixes the join order: `observations` is the outer loop, read through `idx_observations_timestamp` for the window, and each row looks up its transmission by primary key. Results are the same rows; it is still an inner join. The query text moves into `reachScanSQL(nTokens)`, so a test can inspect the plan. ## Measurements Read-only on a database with 18.3M observations and 1.5M transmissions (Python `sqlite3` 3.45.1 on the host), 7-day window: | node (rows returned) | `JOIN`, first run | `JOIN`, warm | `CROSS JOIN`, both runs | |---|---|---|---| | busiest relay (54,387) | 10.29 s | 3.27 s | 1.95 s | | quartile (3,913) | 3.16 s | 3.15 s | 1.81 s | | median (1,310) | 3.17 s | 3.18 s | 1.82 s | | a repeater reported as timing out in the browser (34,209) | 14.11 s | 3.25 s | 1.93 s | On that instance `/api/nodes/:pubkey/reach` reports p95 188.6 s and max 192.6 s over 34 calls in `/api/perf`; a single uncached call from the host took 3.4 to 3.6 s, so most of that is waiting for the 2 build slots and the read pool. On a staging instance (smaller database), with unique cache keys and `days` 6 or 7, one cycle per build after the ingestor's startup `ANALYZE` had finished: | | without this PR | with this PR | |---|---|---| | sequential, 12 calls, p50 | 3402-3801 ms | 2078-2467 ms | | 2 concurrent clients (= `reachMaxConcurrentBuilds`), p50 / p95 | 3575-4087 / 4049-5291 ms | 2271-2462 / 2814-2928 ms | | calls completed in 120 s | 58-68 | 96-101 | The staging builds also contain #2147. ## Verification - `TestReachScanStartsFromObservationsTimeIndex` creates the two production indexes, loads the `sqlite_stat1` values from the 18.3M-observation database, and checks that the plan starts with `SEARCH o USING INDEX idx_observations_timestamp`. With the old `JOIN` it fails with the production plan (`SCAN t`, then `SEARCH o USING INDEX idx_observations_tx_ts`). - The existing reach tests (`TestScanReachRows_DecodesRows`, `TestScanReachRows_CapTruncates`, attribution tests) pass unchanged. - `cmd/server`: `go test ./...` green. ## Not in this PR - The scan still reads every observation in the window and applies the `LIKE` per row, so its cost grows with the window and with traffic. Removing the scan needs an index on hop tokens (for example a table the ingestor maintains). I have not measured what that would cost in storage. - The build-slot limit (2) and the 5-minute cache are unchanged. Co-authored-by: Claude Opus 5.5 <noreply@anthropic.com> |
||
|
efitenandClaude Opus 5.5
|
f50312767f |
fix(server): no SQL while holding PacketStore.mu (#2147)
Refs #2146 (first item: "Stop issuing SQL while holding `store.mu`").
## Situation
Several store functions ran SQLite queries while holding
`PacketStore.mu`. The server's read pool has 4 connections
(`db.go:153`), so a store-lock holder could wait for a pool connection.
`mu` is a `sync.RWMutex`: once the ingest poller asks for the write
lock, every new reader queues behind it, including `/api/healthz`. A
test that scans the package (below) finds 16 such call sites on `master`
at
|
||
|
efitenandClaude Opus 5.5
|
2456762179 |
feat: account data export and users.db backup (#2141)
A small follow-up to parts A to E of #2128: users can download all data the instance holds about them, and the server backs up `users.db`. Stacked on #2140. Review the commits after that branch. ## The situation - An instance with accounts holds personal data, but a user has no way to get a copy (GDPR articles 15 and 20). Self-delete already exists. - `users.db` is the only file the server writes, and nothing backs it up: `GET /api/backup` snapshots the analyzer database only. ## What this PR adds **Data export.** `GET /api/account/export` and a "Download my data" button on the account page give one JSON file with: - the profile, including activation and a pending email change; - sessions (times and user agent); - synced settings, own proposals, notification prefs and watches; - audit rows where the user is actor or target, with other accounts as an id only; - the mail log. Password hash, session and link tokens and the unsubscribe token are left out: they are credentials. Each export is audited as `user.export`. **users.db backup** - Daily `VACUUM INTO` snapshots through `internal/users`, on by default when user management is on. They go to `backups/` next to `users.db`, the 7 newest are kept, the directory is 0700 and the files 0600. Rotation only touches `users-<timestamp>.db` files and never the snapshot it just wrote. Config: `userManagement.backup {enabled, dir, keep}`. - `GET /api/admin/users-backup`: an admin downloads a fresh snapshot to keep off the server; audited as `user.backup`. - `docs/user-guide/accounts.md` gains a restore procedure. It covers what a restore brings back (accounts deleted after the snapshot, old passwords, revoked sessions) and how to clean that up afterwards. Spec: [`docs/specs/2026-10-08-account-export-and-users-backup-design.md`](https://github.com/efiten/CoreScope/blob/feat/account-export-backup/docs/specs/2026-10-08-account-export-and-users-backup-design.md). ## Verification - `internal/users` with `-race` and the `cmd/server` suite pass locally, 30 new Go tests. The file-mode tests skip on Windows. - `sh test-all.sh` exits 0; the XSS gate in diff mode passes. - User-management E2E: 27 of 27 steps locally. - On our production instance since 8 October 2026; the first snapshot there was 143 kB. ## Not in this PR - Importing an export into another instance. - Off-site upload of the snapshots. The admin download covers that by hand. --------- Co-authored-by: Claude Opus 5.5 <noreply@anthropic.com> |
||
|
efitenandClaude Opus 5.5
|
de364a8bb6 |
feat: mail notifications for watched nodes (user management part E) (#2140)
Part E of #2128: a logged-in user watches nodes and gets one mail when a watched node goes offline, comes back, or reports a low battery. Admins can add instance events: a new foreign node, and an observer going offline or back. This covers the per-user mail part of #775. Stacked on #2139 (part D, which builds on #2138). Review the commits after that branch. ## The situation A sysop learns that a repeater went silent, or that its battery is running down, only by opening CoreScope. #775 asks for notifications. Accounts (part A) now give a verified address to mail and a mailer with delivery status. ## What this PR adds **Events.** They use the instance thresholds, so a mail does not disagree with the node page: - `node.offline`: silent for the role's `healthThresholds` window. Last heard comes from the packet store, and repeaters and rooms count relayed traffic (#1598). - `node.battery`: advert telemetry below `batteryThresholds.lowMv`, recovered at `lowMv + 100`. - Admins only: `foreign.new` (once per node) and `observer.offline`. **Store.** Schema v5 with `notification_prefs`, `notification_watches` and `notification_state`. **Server** (only with `userManagement.notifications.enabled`) - A notifier next to the janitor, every `intervalMinutes` (5). The evaluator is a pure function of watches, prefs, stored states and node snapshots. - No burst after a restart or a new watch: a subject's first evaluation stores its state without mailing. The loop waits for the startup load. While ingest is stale (newest packet older than 30 minutes) the offline checks pause, and after recovery they wait one silent window. - One mail per user per check. Limits: 20 per user and 100 per instance per rolling 24 hours, 50 watches per user. A change over a limit is recorded and never mailed later. - Every mail has a one-click unsubscribe (`List-Unsubscribe` and `List-Unsubscribe-Post`). The GET only redirects to a confirm page, so link scanners cannot unsubscribe anyone. Node names are cleaned of control and bidi characters before they go into a mail. - Routes: `GET`/`PUT /api/account/notifications`, `PUT`/`DELETE /api/account/notifications/watches/{pubkey}`, `POST /api/account/notifications/watch-my-nodes` (copies the synced "my nodes" list), `GET`/`POST /api/notifications/unsubscribe`. `mailer.Message` gains `Headers`. **Frontend.** A "Notify me" toggle on the node pages, a Notifications section on the account page (`#/account?section=notifications`), an unsubscribe page, and the notification mail count on the admin overview. Spec: [`docs/specs/2026-10-07-node-notifications-design.md`](https://github.com/efiten/CoreScope/blob/feat/notifications/docs/specs/2026-10-07-node-notifications-design.md). ## Performance Each check reads watches, prefs and states from `users.db` (one query each), the watched nodes from the analyzer DB in chunks of 500, and last-heard times from the packet store. | Measurement | Result | |---|---| | One check on our staging instance, 130,000 packets in memory, 1 watcher | 6.9 ms, of which 0.93 ms holding the store read lock | | Evaluator benchmark, 100 users with 50 watches each, 2,000 nodes | 1.75 ms | No work is added to ingest, broadcast or any request path. ## Verification - `internal/users` and `internal/mailer` with `-race`; the `cmd/server` suite plus `-race` on the notifier tests; 74 new Go tests. The same Windows-only failure as noted in #2138 applies. - `sh test-all.sh` exits 0; the XSS gate in diff mode passes. - User-management E2E: 26 of 26 steps locally. With notifications off the new steps fail, so they do test the flag. - On our staging and production instance since 7 October 2026. ## Not in this PR - Other channels (Discord, Telegram, webhooks). Detection is separate from delivery, so one can be added. - The topology, RF and anomaly alerts of #775. - If the whole server starts after a feed outage that already ended, the grace window is unknown and a watcher can get one wrong offline mail. The user guide says so. --------- Co-authored-by: Claude Opus 5.5 <noreply@anthropic.com> |
||
|
efitenandClaude Opus 5.5
|
abbe6846ff |
feat: propose and approve hashtag channels (user management part D) (#2139)
Part D of #2128: logged-in users propose a hashtag channel, an admin approves, rejects or later revokes it, and the ingestor decrypts approved channels without a restart. It is the first consumer of a generic proposal table, and answers the request in #2092. Stacked on #2138 (part C). Review the commits after that branch; GitHub shows C's commits here until it is merged. ## The situation - An instance decrypts only the hashtag channels listed in `hashChannels`. Users who want a city or club channel shown have to ask the operator, who edits `config.json` and restarts the ingestor. - #2092 asked for a suggest-and-approve flow; a downstream fork (dborup/CoreScope#99) runs one with anonymous suggestions and a file queue. ## What this PR adds **Name rules (`internal/channel`).** `ValidateHashtagName`, mirrored in the browser: - at most 31 UTF-8 bytes including `#` (firmware `ChannelDetails.name[32]`), case preserved, `Public` refused in any case; - control, bidi, separator and format characters refused except ZWJ, plus invisible fillers (`Other_Default_Ignorable_Code_Point`, U+2800, non-ASCII spaces). Go and JS give the same verdict for every code point. **Store.** Schema v4, one generic `proposals` table (kind, subject, status pending/approved/rejected/revoked, proposer, reviewer, note). One row per (kind, subject); limits are checked in the same transaction as the change. **Server** (only with `userManagement.channelProposals.enabled`) - `POST /api/proposals`, `GET /api/account/proposals`, `GET /api/admin/proposals`, `POST /api/admin/proposals/{id}/approve|reject|revoke`. - 400 for an invalid name. 409 for a duplicate, a rejected name, or a name already in `hashChannels`/`channelKeys` ("this channel is already decrypted on this instance"). 429 over a limit (`maxPending` 100, `maxApproved` 128, `perUserPerDay` 5). - `GET /api/channels` gains `approvedChannels`, so approved channels are listed before they have traffic. With the feature off the response is byte-identical. **Ingestor.** Opens `users.db` with `mode=ro` every 60 seconds, re-validates the names, and swaps its key map through an `atomic.Pointer`. Configured channels always win, and a failed read keeps the last good set. The ingestor never writes `users.db`; AGENTS.md now says so. **Frontend.** "Propose for everyone" in the add-channel dialog, an "approved" marker in the channel list, "My proposals" on the account page, and an admin "Proposals" tab with a warning on approve. The packet detail pane now escapes the channel name: until now only the operator chose those names. Spec: [`docs/specs/2026-10-07-channel-proposals-design.md`](https://github.com/efiten/CoreScope/blob/feat/channel-proposals/docs/specs/2026-10-07-channel-proposals-design.md). ## Performance Every key is tried on each GRP_TXT that no key opens (`decodeGrpTxt`). Benchmark of that worst case: | Keys | Time per packet | |---|---| | 320 configured | 204 to 216 µs | | 320 configured + 128 approved | 272 to 320 µs | That is about +33%, linear in the key count and capped by `maxApproved`. With the feature off the decoder gets the identical map and no ticker runs. ## Verification - `internal/channel`, `internal/users` (with `-race`), `cmd/server` and `cmd/ingestor` pass locally, 53 new Go tests. The ingestor's `TestWriteStatsAtomic_SymlinkAtDestIsReplaced` needs symlink rights on Windows and fails on `master` too. - `sh test-all.sh` exits 0; the XSS gate in diff mode passes. - User-management E2E: 21 of 21 steps locally (propose, approve, the channel appears, revoke removes it). - On our staging and production instance since 7 October 2026. ## Not in this PR - Private (PSK) channels: their keys stay in the browser (#725). - Anonymous proposals. - Names that need ZWNJ (some Persian and Urdu spellings) and subdivision flags are refused, because ZWNJ and tag characters are format characters. Allowing them later only widens the rule, so no approved name gets stranded. --------- Co-authored-by: Claude Opus 5.5 <noreply@anthropic.com> |
||
|
efitenandClaude Opus 5.5
|
18a634c115 |
feat: admin dashboard with overview and audit log (user management part C) (#2138)
Part C of #2128: an admin area with an overview, the user table and a global audit log. Off by default like the rest of user management: with `userManagement` off nothing changes, and non-admins get no new UI. This is the first of 4 stacked PRs (C, D, E, then a small export/backup follow-up). Each later one contains this branch; review them in order. ## The situation - An admin could manage users one by one in `#/admin/users`, but nothing showed whether the instance needs attention: accounts stuck in activation, bouncing mail, someone guessing a password, an MQTT source that dropped. - The audit log existed (`internal/users/audit.go`) but could only be read per user, and logins were not recorded. ## What this PR adds **Store (`internal/users`)** - Schema v3: an index on `audit_log(at)`. - `AuditList` with filters (action or group prefix like `user.login.*`, user as actor or target, period) and keyset pagination; `PruneAudit`; `Stats` for the user figures. **Server** - `GET /api/admin/stats` (typed struct): accounts by status, admins, registrations and active users over 7 and 30 days, logins and failed logins in 24 hours, mail by final status, and the attention items computed server-side. - `GET /api/admin/audit`: filtered, newest first, `next` cursor. - `GET /api/admin/users` gains `bouncing=1`. - Logins are audited as `user.login` and `user.login.failed` (reason `wrong_password`, `pending` or `disabled`). An unknown address writes no row. The writes are asynchronous, so the login response does not wait on `users.db`. Login rows are pruned after 90 days. **Frontend** - `#/admin?tab=overview|users|audit`: `admin.js` (tab shell), `admin-overview.js` ("Needs attention", Users card, System card from the existing health, MQTT and observer endpoints), `admin-audit.js` (filters in the URL, "Load more"). `admin-users.js` becomes the Users tab; the old `#/admin/users` link rewrites to it. - `/api/healthz` is read on open and on Refresh only, not on the 60-second timer, because it walks every packet under a read lock. Spec: [`docs/specs/2026-10-07-admin-dashboard-design.md`](https://github.com/efiten/CoreScope/blob/feat/admin-dashboard/docs/specs/2026-10-07-admin-dashboard-design.md). ## Verification - `internal/users` and `cmd/server`: `go vet` and `go test` pass locally, 26 new Go tests. One upstream test, `TestSaveGeoFilterPreservesFileMode`, also fails on Windows on plain `master` (file modes) and is unrelated. - `sh test-all.sh` exits 0; the XSS gate in diff mode passes. - User-management E2E with the `e2etest` build: 13 of 13 steps locally. - Running on our staging and production instance since 7 October 2026. ## Not in this PR - Restricting existing pages (perf, MQTT status) to logged-in users or admins. The admin area adds no access mechanism of its own, so that stays a later router rule plus endpoint check. - Server-enforced customizer tab restrictions (#1508). - The 24-hour, 5-attempt and 10-minute attention thresholds are constants for now (AGENTS.md rule 8: customizer later). --------- Co-authored-by: Claude Opus 5.5 <noreply@anthropic.com> |
||
|
nullrouten0andClaude Mythos 5.1
|
caa66356bd |
fix(api): cap concurrent cold reach scans at 2, answer 429 beyond that (#2127)
`GET /api/nodes/{pubkey}/reach` is unauthenticated and a cold-cache
request runs a full scan. `singleflight` only collapses identical keys,
so distinct `(pubkey, days)` requests each start a scan, and they share
the 4-connection SQLite pool with every other handler. A handful of
requests for different nodes can hold every reader and stall the whole
API.

**Fix:** a small semaphore allows two cold scans at once. A cold request
that finds both slots busy gets `429` with `Retry-After: 5` instead of
queueing. Cached answers are unaffected, and the two in-flight scans
still complete normally.

**Tests:** `node_reach_concurrency_test.go` — with both slots held a
cold request returns 429 with `Retry-After`; after release the same
request runs normally. Full server suite passes.

**Note:** our instance runs a fork that already bounds reach work
differently (an async job queue), so this exact change is not what we
run in production. The test suite is the verification here.

🤖 Generated with [Claude Code](https://claude.com/claude-code)

Co-authored-by: Claude Mythos 5.1 <noreply@anthropic.com>
|
||
|
nullrouten0andClaude Mythos 5.1
|
0a6870c508 |
fix(api): cap request bodies on /api/decode and /api/packets/observations (#2119)
`POST /api/decode` and `POST /api/packets/observations` are unauthenticated and decoded the request body with no size limit. `json.Decoder` buffers the whole value in memory, and `/api/decode` hex-decodes the string before the 184-byte payload check runs. On a test instance one 100 MB request raised RSS by about 180 MB. Many requests in parallel can push a container past its memory limit, and a restart reloads the dataset for several minutes. **Fix:** `http.MaxBytesReader` on both handlers, the same way the geo-filter PUT and `/api/paths/inspect` already do it. | endpoint | cap | why | |---|---|---| | `/api/decode` | 4 KB | a packet is at most ~512 hex chars | | `/api/packets/observations` | 64 KB | 200 hashes of 64 chars is ~14 KB | Oversized bodies get HTTP 413 instead of a generic 400. **Tests:** `body_limits_test.go` — normal bodies still return 200, oversized bodies return 413, for both endpoints. Full `go test ./...` in `cmd/server` passes. **Note:** deployments behind a reverse proxy with its own body limit were already safe. The shipped Caddy config has no body limit, so default installs were not. Running in production on our instance since 2026-10-07. 🤖 Generated with [Claude Code](https://claude.com/claude-code) Co-authored-by: Claude Mythos 5.1 <noreply@anthropic.com> |
||
|
nullrouten0andClaude Mythos 5.1
|
548e4cd4a4 |
fix(api): cap the nodes= list on /api/packets at 50 entries (#2120)
Each entry in the comma-separated `nodes=` list on `GET /api/packets` costs one SQLite lookup (`resolveNodePubkey`) while the packet store's read lock is held. A 1 MB URL fits about 15,000 entries. On a test instance 12,000 entries took 1.3 s per request, against 0.9 ms for one entry, and the lock stalls the poller's writes for that long. A few parallel clients can keep the site busy and the live feed stale. **Fix:** lists longer than 50 entries get HTTP 400 with a clear message. No UI page sends more than a handful. **Tests:** `multi_node_cap_test.go` — 50 entries return 200, 51 return 400. Full `go test ./...` in `cmd/server` passes. Running in production on our instance since 2026-10-07. 🤖 Generated with [Claude Code](https://claude.com/claude-code) Co-authored-by: Claude Mythos 5.1 <noreply@anthropic.com> |
||
|
nullrouten0andClaude Mythos 5.1
|
4ce6d9f6d4 |
fix(ui): pin CDN script versions and add integrity hashes (#2121)
`leaflet.heat` and `chart.js` in `index.html`, and swagger-ui on `/api/docs`, were loaded from unpkg with no `integrity` attribute. `chart.js@4` and `swagger-ui-dist@5` also floated on a major version, so a new release would load unreviewed. A compromised CDN or package would run as our own code on every page. Leaflet itself already had a hash. **Fix:** pin `chart.js@4.5.1`, `leaflet.heat@0.2.0`, `swagger-ui-dist@5.33.1`, each with a sha384 hash and `crossorigin="anonymous"`. **How the hashes were made:** download each pinned file, `openssl dgst -sha384 -binary | base64`, then download again and check the hash matches. **Note:** bumping chart.js or swagger-ui now means updating the hash too. Vendoring them into `public/vendor/` (as markercluster already is) would remove the CDN dependency entirely; happy to do that instead if preferred. Running in production on our instance since 2026-10-07. 🤖 Generated with [Claude Code](https://claude.com/claude-code) Co-authored-by: Claude Mythos 5.1 <noreply@anthropic.com> |
||
|
nullrouten0andClaude Mythos 5.1
|
8b64439635 |
fix(server): keep config.json's file mode when saving the geo-filter (#2126)
`SaveGeoFilter` rewrote `config.json` through a temp file created with mode 0644, so a config an operator had made 0600 (it holds the API key and broker passwords) became world-readable after the first geo-filter save. **Fix:** stat the original and reuse its mode for the temp file. Falls back to 0644 when the stat fails. **Tests:** `config_mode_test.go` — a 0600 config stays 0600 after a save; a 0644 config stays 0644. 🤖 Generated with [Claude Code](https://claude.com/claude-code) Co-authored-by: Claude Mythos 5.1 <noreply@anthropic.com> |
||
|
dborupandClaude Opus 5.5
|
7309bdb5a9 |
fix(store): index a transmission once per relay key in byPathHop (#2117)
Relates to #2108 ## Problem `traffic_share_score` grows with server uptime until it is far above reality, and many relays end up clamped at 1.0. The score is the number of non-advert entries in `byPathHop[pubkey]` divided by the number of non-advert transmissions. `indexResolvedPathHops` runs once per **observation**, on the live-ingest path (`IngestNewFromDB`) and on the late-observation path (`IngestNewObservations`). `addResolvedPubkeysToPathHopIndex` only de-duplicates within one call, so every further observation through the same relay appends the transmission to that relay's bucket again. The denominator counts each transmission once. After a restart the values look right, because `buildPathHopIndex` → `retainResolvedPathHops` de-duplicates by `*StoreTx`. They then drift upwards as live observations arrive. None of the affected functions has changed on `master` since the diagnosis against `415362c`. This branch is based on `000d9ab`. ## Fix 1. **Idempotent insert, per (transmission, relay key).** `addResolvedPubkeysToPathHopIndex` keeps a side map `pathHopResolved map[*StoreTx][]string`. It holds the resolved keys each transmission is already indexed under and skips those. - Keys are compared **exactly**, so no collision can ever drop an entry. - A later observation through a **new** relay still adds that relay, once. - `StoreTx` is unchanged. 2. **Interned keys.** `pathHopKeys map[string]string` keeps one shared copy of each resolved key. The record then holds a 16-byte string header per entry, and not the string each observation's resolve allocated: a fresh `json.Unmarshal` string per persisted observation on `Load`, and a `strings.ToLower` result on the live paths. The `byPathHop` key is the same shared copy. 3. **Eviction and rebuild.** - `evictStaleInternal` drops the record of evicted transmissions, plus any interned key whose bucket it deletes. - `retainResolvedPathHops` keeps the records of live transmissions only and drops interned keys whose bucket was not carried over. When a rebuild starts from an empty index, it clears both. 4. **Defence in depth.** The single (`GetRepeaterUsefulnessScore`), batch (`GetRepeaterNodeStatsBatch`) and bulk (`computeRepeaterUsefulnessScoreMap`) scores count **distinct** non-advert transmissions per bucket, via `countDistinctNonAdvert`. - IDs are collected in a reused slice. - A bucket in ascending ID order is already distinct; only out-of-order buckets are sorted. - The bulk pass does this for full-pubkey keys only. Raw-hop buckets get one entry per transmission from `addTxToPathHopIndex`. 5. **Cache side effect.** A repeated observation through known relays no longer mutates `byPathHop`, so it no longer drops the batch relay-stats cache, as the cache contract from `1164` intends. An observation through a new relay still drops it. The other `byPathHop` consumers already de-duplicate by `tx.ID` or read only raw prefix keys: `GetNodeHopAnalytics`, `computeMultiByteCapability`, `handleNodePaths`, `computeRepeaterRelayInfoMap` and the relay info in `GetRepeaterNodeStatsBatch`. Two tests pin that they ignore duplicate entries. ## Exact keys vs. a 64-bit fingerprint The first version of this fix stored a 64-bit FNV-1a hash per key. As requested, I measured both, plus exact keys without interning, on the real `addResolvedPubkeysToPathHopIndex`. **Keys per transmission.** In the e2e fixture, the union of resolved relay keys over all observations of one transmission has a mean of 5.4 and a maximum of 17. The protocol limit is 64 path bytes (`MAX_PATH_SIZE`), i.e. 64 / hash size hops. **Memory** retained by the record, per transmission. `BenchmarkPathHopRecordMemory_2108`: 100K transmissions, keys from 4,000 relays, each transmission heard twice with freshly allocated keys. The record map and the interned keys are included. | keys per tx | exact, interned (this PR) | 64-bit fingerprint | exact, not interned | |---|---|---|---| | 2 | 88 B | 68 B | 207 B | | 5 | 136 B | 101 B | 447 B | | 17 | 344 B | 197 B | 1,423 B | - At realistic key counts, exact keys cost 20–35 B per transmission more than the fingerprint. That is about 3.5 MB per 100K transmissions, and small next to what the store already charges per transmission (`storeTxBaseBytes` alone is 384 B). - Without interning, exact keys would cost 3–4× more, and most of that would be held during every `Load`. Interning is what makes exact keys affordable. **Time.** I ran the variants interleaved, 3 rounds each, median ns/op on an Apple M4. The record step is not measurable inside the full call. The isolated record step was faster with exact keys in a separate micro-benchmark, because comparing a handful of 64-char strings is cheaper than hashing each one. | benchmark | exact, interned | fingerprint | exact, not interned | |---|---|---|---| | late observation, 20K txs | 312 | 358 | 331 | | late observation, 100K txs | 760 | 836 | 758 | | `IngestNewObservations` (SQL + resolve + index) | 531 µs | 497 µs | 527 µs | **Collision probability of the fingerprint.** For k distinct keys in one transmission it is about k(k−1)/2 / 2^64: | k | per transmission | per 10^9 transmissions | |---|---|---| | 2 | 5.4e-20 | 5.4e-11 | | 5 | 5.4e-19 | 5.4e-10 | | 17 | 7.4e-18 | 7.4e-9 | | 64 | 1.1e-16 | 1.1e-7 | For random keys this is negligible. FNV-1a is unkeyed, though, so two relay keys that collide could be found deliberately (a birthday search over about 2^32 key pairs). A collision would leave a transmission out of one relay's bucket. **Decision.** Exact keys are cheap enough once interned: the same speed within noise, and a few tens of bytes per transmission. They remove the question of collision-driven omissions entirely, so this PR uses exact keys and drops the fingerprint. The two new maps (`pathHopResolved`, `pathHopKeys`) are not added to `trackedBytes`, so the `maxMemoryMB` trigger undercounts by roughly the per-transmission figures above. Both are bounded by live state (eviction and rebuild prune them), so this is a steady proportional undercount rather than a leak. ## Tests **New: `cmd/server/pathhop_dedupe_2108_test.go`.** Behaviour tests that use only existing API. Each one runs against the real SQLite schema through `Load`, `IngestNewFromDB` and `IngestNewObservations` where noted. | test | covers | on `master` | |---|---|---| | `TestPathHopIndexOncePerTx_LateObservations_2108` | 1 + 10 late observations through the same relays: one entry per relay | **fails** (11 entries) | | `TestPathHopIndexOncePerTx_LiveIngestBatch_2108` | 11 observations in one `IngestNewFromDB` batch | **fails** (11) | | `TestPathHopIndexOncePerTx_AfterLoad_2108` | `Load` + rebuild, then one live observation | **fails** (2) | | `TestPathHopIndexAddsNewRelayFromLaterObservation_2108` | a later observation through a **new** relay adds it exactly once, and its share becomes correct | **fails** (2) | | `TestTrafficShareStableAcrossLateObservations_2108` | single, batch and bulk scores agree, equal the definition, stay put over rounds of late observations, and equal a fresh `Load` of the same data | **fails** (all four relays at 1.0, want 0.4–0.5) | | `TestPathHopIndexSizeBoundedByTransmissions_2108` | the index size does not grow with observations | **fails** | | `TestRelayStatsCacheAcrossRepeatedObservations_2108` | a repeated observation keeps the relay-stats cache, and the kept cache equals a fresh compute; a new relay drops it, and the next read sees the relay | **fails** | | `TestAddResolvedPubkeysToPathHopIndex_PerRelayIdempotent_2108` | the helper's return value and cache invalidation per (tx, relay), in any key order | **fails** | | `TestTrafficShareCountsDistinctTransmissions_2108` | all three scores count distinct transmissions in a duplicated bucket | **fails** | | `TestPathHopConsumersIgnoreDuplicateEntries_2108` | pin of the consumer audit | passes (by design) | | `TestMultiByteCapabilityIgnoresDuplicateEntries_2108` | pin of the consumer audit | passes (by design) | **New: `cmd/server/pathhop_record_2108_test.go`.** These tests use the new symbols, so they do not compile against `master`. - `TestCountDistinctNonAdvert_2108`: ascending, descending, interleaved duplicates, adverts, nils, untyped. - `TestPathHopResolvedRecordBoundedAndEvicted_2108`: the record stays at 2 keys after 11 observations. Eviction removes the record and every entry. A survivor's next observation adds nothing. Evicting everything leaves no record, no interned key and no bucket. - `TestPathHopResolvedRecordAcrossRebuild_2108`: a rebuild keeps the records of live transmissions, so the next observation adds nothing. It drops the record of a removed transmission and the interned key only that transmission used. - `TestPathHopResolvedRecordClearedWithEmptyIndex_2108`: a rebuild from an empty index clears the record and the interned keys, and the next observation puts the transmission back. - `TestPathHopResolvedRecordInternsKeys_2108`: record entries and the `byPathHop` key share one copy, even though every observation passes freshly allocated keys. **Changed: `pathhop_eviction_1908_test.go`.** It built its duplicate entries by repeating `indexResolvedPathHops`, which no longer duplicates. It now seeds the duplicates directly, so the `1908` sweep is still tested against buckets that hold one transmission several times. The expected buckets are unchanged. **Changed: `db_test.go`.** `setupTestDB` takes `testing.TB`, so the SQL benchmark can use it. **Mutants.** I applied each mutant on its own to this branch. All 14 are killed: | mutant | killed by | |---|---| | record never consulted | the OncePerTx, stable-share, size, cache and record tests | | dedupe per transmission instead of per relay | `AddsNewRelayFromLaterObservation`, `RelayStatsCacheAcrossRepeatedObservations`, `PerRelayIdempotent` | | eviction keeps the record | `RecordBoundedAndEvicted` | | rebuild keeps records of removed transmissions | `RecordAcrossRebuild` | | rebuild from an empty index keeps the record | `RecordClearedWithEmptyIndex` | | cache dropped on every call | `RelayStatsCacheAcrossRepeatedObservations`, `PerRelayIdempotent`, existing `NoMutation_PreservesCache` | | cache kept although `byPathHop` changed | `RelayStatsCacheAcrossRepeatedObservations`, `PerRelayIdempotent`, existing `InvalidatesRelayStatsCache` | | single score counts entries | `TrafficShareCountsDistinctTransmissions` | | batch score counts entries | `TrafficShareCountsDistinctTransmissions` | | bulk score counts entries | `TrafficShareCountsDistinctTransmissions` | | distinct count trusts any bucket order | `TrafficShareCountsDistinctTransmissions`, `CountDistinctNonAdvert` | | keys not interned | `RecordInternsKeys` | | eviction keeps interned keys | `RecordBoundedAndEvicted` | | rebuild keeps interned keys of dropped buckets | `RecordAcrossRebuild` | **Commands run:** - `gofmt -l` on all tracked Go files: clean. - `go vet ./...` in all 14 modules: clean. - `cd cmd/server && go test -race ./...`: pass. - `cd cmd/ingestor && go test ./...`: pass. - `sh test-all.sh`: 184 of 186 suites pass locally. The other two, `test-issue-1956-release-routing.js` and `test-preflight-xss-gate.js`, shell out to scripts that need bash ≥ 4 (`mapfile`). They fail under macOS's bash 3.2 regardless of this change. This PR touches no frontend or script files. ## Benchmark: `master` vs. this branch I ran `master`'s sources (`000d9ab`) and this branch interleaved, 5 rounds, with the same benchmark files. Medians on an Apple M4. | benchmark | `master` | this PR | change | |---|---|---|---| | late observation through known relays, 20K txs | 446 ns, 38 B/op | 441 ns, 0 B/op | within noise | | late observation through known relays, 100K txs | 710 ns, 69 B/op | 755 ns, 0 B/op | within noise (runs overlap) | | … index size afterwards, entries/tx (20K / 100K) | 24.99 / 8.99, still growing | 4.99 / 4.99 | bounded | | `IngestNewObservations`, one observation for each of 20 txs | 532 µs | 513 µs | within noise | | bulk score pass, clean index, 20K, ingest order | 246 µs | 316 µs | +28 % | | bulk score pass, clean index, 100K, ingest order | 3.03 ms | 4.30 ms | +42 % | | bulk score pass, clean index, 20K, reversed buckets | 257 µs | 467 µs | +82 % | | bulk score pass, clean index, 100K, reversed buckets | 3.38 ms | 4.79 ms | +42 % | | bulk score pass after 11 observations per tx, 20K | 663 µs | 284 µs | −57 % | | bulk score pass after 11 observations per tx, 100K | 4.72 ms | 3.19 ms | −32 % | - On an index that is clean on both builds, the distinct count makes the bulk pass slower. That pass runs on the cache-miss path, which the background recomputer refreshes every 5 minutes by default. - On the index a live server actually holds without this fix, `master` walks every accumulated duplicate, so the real-world pass is faster after the fix. The gap grows with uptime. - The late-observation step no longer allocates. On `master` its index grows with every observation. Benchmarks: `BenchmarkLateObservationIndex_2108`, `BenchmarkIngestNewObservations_2108`, `BenchmarkTrafficShareScoreMap_2108` and `BenchmarkPathHopRecordMemory_2108`. ## Production motivation We have run this fix on two production instances. Before the fix, the summed `traffic_share_score` grew past 180 and many relays sat at the 1.0 clamp; with the fix no node reaches `≥ 0.999`. A controlled 12 h A/B run makes the drift explicit. Two servers read one identical database — one on this `master` base, one with the fix — alongside a reference server that freshly loads the same database (a fresh load is correct, because the rebuild dedupes). The unfixed server drifted to 9 relays at the 1.0 clamp and up to 0.95 absolute error per node against the reference; the fixed server stayed within 0.05 of the reference for every node, with no relay at the clamp. A smaller residual rise remains and is a separate cause (startup-vs-live hop resolution); it is deliberately left for a follow-up so its effect stays measurable. ## Out of scope That remaining slow rise comes from a separate cause: live ingest resolves some hops that the startup load does not. This PR deliberately leaves that drift alone, so its effect stays measurable. The fix will follow in a separate PR. 🤖 Generated with [Claude Code](https://claude.com/claude-code) Co-authored-by: Claude Opus 5.5 <noreply@anthropic.com> |
||
|
efitenandClaude Opus 5.5
|
f3ae8ac25a |
feat: sync a logged-in user's settings across devices (part B) (#2130)
Part B of #2128: a logged-in user's settings follow them across devices. Log in on a phone and your own nodes, favorites, customizer and filters are there; a change on one device reaches the others within a minute or when you return to the tab. **This PR builds on #2129.** Until that one is merged, the diff here includes it. The commits for this part start at `docs(specs): settings sync for optional user management (sub-project B)`. ## The situation Everything a visitor sets up lives in one browser's `localStorage` (about 100 keys in `public/`). A second device or a cleared cache starts from zero (#895). ## What this PR adds **Storage.** `users.db` schema v2: one JSON document per user in `user_settings`, with a revision number and a generation id. A write succeeds only when the client's revision and generation match the stored ones, so two devices cannot overwrite each other silently. **Server.** `GET`, `PUT` and `DELETE /api/account/settings`, behind the same session and CSRF checks as the account routes. - The server owns the list of synced keys (61 keys, [`settings_allowlist.go`](https://github.com/efiten/CoreScope/blob/feat/settings-sync/cmd/server/settings_allowlist.go)) and sends it to the client, so the two cannot drift. - A hard denylist, checked first, refuses `meshcore-api-key`, every `corescope_channel_*` key and `live-channel-colors` (#725). The colour map is keyed by channel hash, and for a user-added channel that hash is `user:<name>`, which would expose hashtag channel names. - Documents are capped at 256 KiB, measured like `JSON.stringify`. PUT is limited to 60 requests per hour per user. A stale revision gets 409 with the current document. **Client** ([`settings-sync.js`](https://github.com/efiten/CoreScope/blob/feat/settings-sync/public/settings-sync.js)). Inert unless the feature is on and someone is logged in. - It wraps `localStorage.setItem` and `removeItem` for allowlisted keys only and pushes 2 seconds after the last change. - It pulls on login, page load, tab focus and every 60 seconds while the tab is visible. - **Merge:** three-way, against a per-device baseline that belongs to one user and one document generation. Lists (own nodes, favorites, saved filters) merge per item, so an item added anywhere is kept and an item removed on one device does not come back from another. Single values: the profile wins unless only this device changed it. - Remote changes are written without a push, theme and colour-blind preset are re-applied, and the current page re-renders (skipped on account pages and while the geofilter editor is open). **UI.** - Logout asks: keep my settings on this device (default), remove them from this device, or cancel. Channel keys are never removed: no copy exists anywhere else. - The account page gets a "Settings sync" section: last synced time, "Sync now", what is and is not synced, and "Delete synced settings from my account". ## Not synced Layout and device state (panel and column widths, collapsed panels, map positions, geofilter drafts), channel data (#725), the API key, and all `sessionStorage`. The full list is in the [spec](https://github.com/efiten/CoreScope/blob/feat/settings-sync/docs/specs/2026-10-06-user-settings-sync-design.md). ## Performance - One GET per page load, tab focus and minute while visible; one debounced PUT per burst of changes. - The `setItem` wrapper costs one Set lookup per write for non-synced keys. A synced write reads one small revision key, not the stored document. - The server reads or writes one row per request. ## Verification - `internal/users` and `cmd/server`: `go vet` and `go test` pass locally (22 new Go tests), including a test that every allowlisted key still occurs in `public/`, and denylist tests. - `tests/unit/test-settings-sync.js`: 79 passing (vm, real module). The cases cover the merge table, two tabs sharing one storage, stale answers after a push, delete while a push is in flight, and logout while the final push fails. - `sh test-all.sh` exits 0. - `tests/e2e/test-user-management-e2e.js` (10 steps, 4 of them new) passed locally with two browser contexts as two devices: a favorite and the packet time window travel from device 1 to device 2, a removal does not come back, and "remove from this device" clears the synced keys while a channel key stays. - Checked by hand on a staging instance with a desktop and a phone on one account. ## Not in this PR - On a shared browser where the previous user chose "keep", the next user's first login merges those settings into their own account. The user guide says to choose "remove" on shared computers. - Saved filter expressions are synced as typed, including any channel names written in them. The guide says so. - Realtime push between devices; the minute pull is the sync interval. --------- Co-authored-by: Claude Opus 5.5 (1M context) <noreply@anthropic.com> |
||
|
efitenandClaude Opus 5.5
|
d232072f85 |
feat: optional user accounts (part A: foundation) (#2129)
Part A of #2128: optional, off-by-default user accounts. With the feature off nothing changes; with it on, visitors can register and log in, and admins manage users and use the operator actions without the API key. PR #2130 (settings sync) builds on this one. The two are meant to be merged together. ## The situation - Operator actions (geofilter save and prune, backup, perf reset) need the shared `apiKey`. There is no per-person right. - Nothing in CoreScope knows who a visitor is, so the requests in #2128 that need that (#1835, #2092, #1508, #730) have nothing to build on. ## What this PR adds **Two new Go modules** - `internal/users`: a separate `users.db` (SQLite through `modernc.org/sqlite`) with users, sessions, single-use tokens, an audit log and a mail log. Passwords use argon2id. - `internal/mailer`: a `Mailer` interface with a Brevo client (send, delivery events, webhook parsing) and an in-memory fake for tests. **Server (`cmd/server`)**, active only with `userManagement.enabled` - 24 routes, all documented in OpenAPI under the `users` tag ([`auth_routes.go`](https://github.com/efiten/CoreScope/blob/feat/user-management/cmd/server/auth_routes.go)): - auth: register, activate, login, logout, me, forgot, reset; - account: profile, password, email change with confirmation, sessions, self-delete; - admin: list, detail, disable, enable, delete, role, resend activation, manual activation, mail status refresh; - a Brevo webhook, registered only when `mail.webhookSecret` is set. - `requireAdmin` replaces `requireAPIKey` at the 7 operator call sites: the API key **or** an admin session. With the feature off it is the old API-key gate (`TestRequireAdminWithoutUserManagementIsAPIKeyGate`). - `/api/config/client` gets `userManagement: {enabled: true}` only when the service started; with the feature off the response is byte-identical. **Frontend** - `auth.js` (header account control, request helper that adds the CSRF header), `account.js` (login, register, activate, forgot, reset, confirm email, my account), `admin-users.js` (`#/admin/users`, deep-linked filters), `account.css` (theme tokens only). - On phones the top-bar control is hidden, so a conditional entry goes into the bottom-nav "More" sheet and the nav drawer. - The customizer geofilter tab and the Perf "Reset stats" button use the admin session when there is one. **Config.** A `userManagement` block (`config.example.json`, [`docs/user-guide/accounts.md`](https://github.com/efiten/CoreScope/blob/feat/user-management/docs/user-guide/accounts.md)). The Brevo key can come from `CORESCOPE_BREVO_API_KEY`. The server refuses to start when the block is enabled but incomplete. ## Security choices - Session cookie `cs_session`: HttpOnly, SameSite=Lax, Secure when `publicBaseUrl` is https. Every cookie-authenticated state change needs the `X-CS-CSRF` header and a matching Origin. - Activation needs the token **and** the account password. Without the password, an attacker who keeps re-registering a known address could get the owner to activate an account that carries the attacker's password. - Register, forgot and email change answer identically for known and unknown addresses. A password reset ends all sessions, a password change ends all other sessions, and both end outstanding email-change links. - Rate limits: login 10 per 15 minutes, register and forgot 5 per hour, per IP and per address. The bucket count is capped. `trustedProxies` makes the per-IP limits see real client IPs behind a proxy. - Server logs carry `#<user id>`, never addresses, tokens or passwords; mail-provider error texts are redacted before logging. ## Performance No change to an existing hot path with the feature off. With it on: - One `users.db` lookup per authenticated request (session by token hash). - The admin user table rebuilds its `tbody` on each filter change. `users.List` caps the result at 1000 rows (`internal/users/users.go`), which bounds the rebuild. - `map[string]interface{}` in `openapi.go`: 79 before, 78 after. ## Verification - `internal/users`, `internal/mailer` and `cmd/server`: `go vet` and `go test -race` pass locally. 121 new Go tests. - `cmd/server` with `-tags e2etest`: vet and the e2e hook tests pass. - `sh test-all.sh` exits 0. `tests/unit/test-user-management-ui.js`: 67 passing (vm, real modules). - `tests/e2e/test-user-management-e2e.js` (6 steps) passed locally against an `e2etest` build with the fake mailer and against a feature-off build. CI builds the `e2etest` binary and runs the suite on a second server (`deploy.yml`). - On a staging instance with a real Brevo key: register, activation mail delivered, activate, admin table, "Refresh status" showing sent, deferred, delivered, opened and clicked. ## Not in this PR - Settings sync (#2130), the admin dashboard, approval flows and notifications (parts B to E of #2128). - A `requireReadAuth` mode (#1835). Sessions from this PR are what such a mode would accept. - Binary size and build time with `modernc.org/sqlite` linked next to `mattn/go-sqlite3` were not measured. Their driver names do not collide. #1992 discusses the driver choice. - No Brevo webhook was configured on staging; delivery status there came from "Refresh status". --------- Co-authored-by: Claude Opus 5.5 (1M context) <noreply@anthropic.com> |
||
|
efitenandClaude Opus 5.5
|
4363403495 |
fix(nodes): match the region node filter on observer ID, not ingest-time IATA (#2115)
Follow-up to #2114, from its review. `RegionNodePubkeys` compared the IATA copied onto each observation at ingest (`StoreObs.ObserverIATA`). When an operator changes an observer's code, those copies stay as they were until a restart or until the observations age out. `/api/nodes?region=` then kept matching the old region, while the other store region filters already used the new one. Those filters resolve observers by ID through `resolveRegionObservers`, for example the packets query and `computeNodeHomeRegions`. The SQL subquery that #2114 replaced also read `observers.iata` at query time, so this restores that behaviour. ## Also fixes a regression from #2114 Found in review: `loadChunk`, the background history loader (`cmd/server/store.go`, the chunk SELECT and the `StoreObs` it builds), sets `ObserverID` on each observation but never `ObserverIATA`. With #2114 matching on that IATA, **every node whose adverts came only from background-loaded history dropped out of `/api/nodes?region=`** on current master. Matching on observer ID fixes it. `TestRegionNodePubkeysMatchesChunkLoadedObservations` pins it (an observation with the observer ID and an empty IATA) and fails on master's `region_nodes.go`. ## Change - Resolve the region to observer IDs with `resolveRegionObservers` (own mutex, 30 s cache) and match observations by `ObserverID`. Lock order: `regionNodesMu` is released before it, and `s.mu` is taken after it; none of the three is held together. - Without a database there is nothing to resolve, so `RegionNodePubkeys` reports no set and the handler keeps the SQL path. ## Tests - The region tests now seed an observers table and leave each observation's IATA at a stale value, so they can only pass through the table. - New `TestRegionNodePubkeysFollowsObserverIATAChange`: an observer that moved from SJC to SFO matches SFO and not SJC. It fails on the previous code (`got [pk_moved]` for SJC). - `TestRegionNodePubkeysMatchesChunkLoadedObservations` (second commit), see above. - `setupTestDB` takes `testing.TB` so the benchmark can use it; every existing caller passes `*testing.T` unchanged. - Full `cmd/server` suite passes locally, the region tests also with `-race`. ## Performance `BenchmarkRegionNodePubkeys` (220k adverts × 8 observations): 37 ms to 30 ms per uncached scan, a map lookup per observation instead of a string normalisation. The observer lookup is one query on the small `observers` table, cached for 30 s. ## Not done - No singleflight on a cold cache, and the 64-entry cache still resets when full. Both were non-blocking in the #2114 review. --------- Co-authored-by: Claude Opus 5.5 <noreply@anthropic.com> |
||
|
efitenandClaude Opus 5.5
|
d5e6d1b2a6 |
fix(nodes): resolve the /api/nodes region filter from the packet store (#2114)
Fixes #2101. `/api/nodes?region=` filtered nodes with a subquery that joins every advert to all of its observations and observers, with no time bound (`cmd/server/db.go`, `GetNodes`). It ran twice per request, once for `COUNT(*)` and once for the page. A client paging through nodes repeats both per page. ## Reproduced On our staging database (10.3 GB, 16.5M observations, 219,750 adverts), read-only `sqlite3`, region `BRU`: | | real | user | sys | |---|---|---|---| | one regional `COUNT(*)`, as `GetNodes` builds it | **154.8 s** | 1.9 s | 5.8 s | Almost all of it is waiting on disk. The plan walks `idx_transmissions_payload_type` for every advert and then `idx_observations_dedup` for each one's observations. Two of those per request, a few requests at once, and the reader pool is gone, which matches the report of all four database workers sitting in `GetNodes`. ## Fix - **`PacketStore.RegionNodePubkeys(region)`** (new `cmd/server/region_nodes.go`) walks the store's in-memory adverts (`byPayloadType[ADVERT]`) once. It keeps the pubkey of every node with an advert heard by an observer in the region, using the `ObserverIATA` each observation already carries. It is cached for 30 s per region, and the cache is bounded to 64 entries because its keys come from the client's parameter. Lock discipline follows `resolveAreaNodes`: the cache mutex and `s.mu` are never held together, and the ordering note in `store.go` lists it. - **`GetNodes` takes a `NodeQuery` struct** with a `RegionPubkeys` field, passed as one `json_each` parameter: `public_key IN (SELECT value FROM json_each(?))`, a primary-key lookup. An empty set matches nothing. The SQL subquery stays for a server without a store (tests, tooling). - The advert-pubkey lookup that `trackAdvertPubkey`, `untrackAdvertPubkey` and `computeNodeHomeRegions` each copied is now one helper, `advertPubkey`. The struct instead of a second `GetNodes` variant keeps the `map[string]interface{}` count unchanged in `db.go` (75) and `routes.go` (59). ## Behaviour change The region filter now covers the adverts the store holds (`packetStore.retentionHours`), which is the window the rest of the UI shows, instead of all database history. A node heard in a region only before that window no longer matches the filter. While the store is still loading after a restart, the set grows as history loads. ## Performance | | before | after | |---|---|---| | region set, uncached | 154.8 s (SQL count, staging) | 37 ms (`BenchmarkRegionNodePubkeys`: 220k adverts × 8 observations, 4,000 nodes) | | region set, within 30 s | same again | cache hit | | node count over the set | (included above) | 2 ms on staging (1,200 keys) | | 500-row page over the set | same scan again | 3 ms on staging | The scan holds `s.mu` for reading for those 37 ms, at most once per region every 30 s. ## Tests - `TestRegionNodePubkeys`: the in-region advert, an advert heard in two regions, case and whitespace in codes, a comma list, an unknown region giving an empty set, a non-advert never counting, a blank region giving no filter. - `TestRegionNodePubkeysCached`, `TestRegionNodePubkeysCacheIsBounded` (1,000 distinct regions stay within 64 entries). - `TestGetNodesRegionPubkeys`: the set combines with the role filter and counts correctly, and an empty set returns nothing even with `Region` set. - `TestHandleNodesRegionUsesStore`: an advert that only the store knows about shows up through `/api/nodes?region=`, so the handler is proven not to ask SQL. - Existing region tests (`TestGetNodesRegionFilterV2` and the `db_test.go` region cases) pass unchanged through the SQL fallback. Full `cmd/server` suite passes locally; the new tests also pass with `-race`. ## Not done - No request context on these queries, also raised in the issue. With the scan gone they take milliseconds, so I left that out of this change. - The region semantics stay "heard by an observer in the region". #1879 argues for the node's home region instead; that is a separate decision. - No frontend change. I did not check this in a browser; the nodes page and map call the same endpoint with the same parameters. Co-authored-by: Claude Opus 5.5 <noreply@anthropic.com> |
||
|
Sylvain Rabot
|
b5b230e884 |
feat(channels): show the sender's path hash size on each message (#2089)
Each channel message now shows the hash size its sender's path uses, read from bits 7-6 of the path byte that the originator writes and repeaters keep. The server sends it as path_hash_size (packetpath.HashSize); the frontend helper pathHashSize() applies the same rule and returns 0 for unknown. One rule on both pages: the packet detail Hash Size row and the hex breakdown call pathHashSize() too, so a 0-hop flood message reports the same size on Channels and on its packet page. A direct packet with no hops left reports no size, matching cmd/server/decoder.go. The cases live in test-fixtures/path-hash-size-cases.json, read by the Go and JS tests. |
||
|
efitenandClaude Opus 5.5
|
000d9ab030 |
feat(coverage): RF noise-floor layer on the Mobile RX coverage page (#2113)
The ingestor already stores the noise floor that CoreDrive RX companions
report with each GPS fix (`client_rf_samples`, opt-in through
`clientRfSamples`, `cmd/ingestor/client_rf_sample.go:62`), but nothing
reads it back. An operator who enables it collects the data and cannot
see it. This adds the read side: `GET /api/rf-noise` and a Signal/Noise
toggle on the Mobile RX coverage page.

## What it does

- **`GET /api/rf-noise?bbox=&z=&days=`** returns a GeoJSON hex grid with
the median, quietest and noisiest noise floor per cell, in the same
shape as `/api/rx-coverage`. It is registered always and 404s unless
`clientRfSamples.enabled` is true, the same pattern as the coverage
routes.
- **Stationary samples are excluded.** A parked companion logs hundreds
of readings at one point, which would otherwise define its cell.
- **Coverage page:** a Signal/Noise toggle, rendered only when
`/api/config/client` reports `clientRfSamples: true`. The noise layer
reuses the coverage colour tokens with the axis inverted, because a
lower dBm is quieter. Tiers are at -115 and -108 dBm.
- **Deep link:** `#/rx-coverage?layer=noise` opens on the noise layer.
- **Empty and failed answers** are labelled on the map ("No RF samples
in this view yet", or a retry hint), so a blank map never reads as
"feature off".

No new configuration key: it reads the existing `clientRfSamples`
section that the ingestor already uses. Default off, so nothing changes
for an instance that has not opted in.

## Where it comes from

Ported from the efiten/CoreScope fork, where it has run on
analyzer.on8ar.eu since September (fork commits `42d09f0e`, `80581c43`,
`cde95078`). The cherry-picks conflicted with upstream's newer
`routes.go`, `types.go` and `rx-coverage.js`, so the final state was
ported by hand. The fork-only `/scopes` route that sat next to it in the
same hunk is deliberately left out.

## Performance

The query is bounded by `sampled_at` (indexed, `idx_crf_prune`) and the
bbox, aggregation is one pass plus a per-cell sort, and the response is
capped at 5000 cells. Measured on analyzer.on8ar.eu, all of Belgium
(`bbox=49.4,2.4,51.6,6.5&z=9`), from a client in Belgium, so network
time included:

| window | samples | cells | response time |
|---|---|---|---|
| 7 days | 10,835 | 241 | 0.37 s |
| 30 days | 43,303 | 429 | 0.39 s |

That table holds 45,270 rows in total. It is only read when someone
opens the noise layer, never on ingest or WebSocket paths.

## Tests

- `cmd/server/rf_noise_test.go`: 8 tests for the aggregation (median and
extremes, stationary exclusion, the cell cap, empty input) and the gate
(404 when off, even with data present). All pass, and the full
`cmd/server` suite passes locally.
- `tests/unit/test-rx-coverage-noise.js` (new, in `test-all.sh`): the
colour axis runs the right way, including both tier bounds and a string
median from the API. Slices the real function out of `rx-coverage.js`
and fails on master's copy, which has no thresholds.
- `tests/e2e/test-rx-coverage-noise-e2e.js` (new, wired in `deploy.yml`
and `scripts/non-unit-tests.json`): no toggle when the flag is off;
Noise fetches `/api/rf-noise`, draws the cells, swaps legend and
subtitle, puts `layer=noise` in the hash; a deep link opens on the noise
layer and an empty answer shows the message. 3/3 locally; against
master's `rx-coverage.js` and `roles.js`, 1/3 (only the "flag off" case
passes, as it should).
- `test-rx-coverage-viewport-e2e.js` still passes. ESLint 8 reports 0
errors on the changed files.

## Not done

- The thresholds (-115 / -108 dBm) are fitted to the fork's own data
(1,241 moving samples at the time) and are constants in
`rx-coverage.js`. Per AGENTS.md rule 8 they belong in the customizer
eventually; not in this PR.
- The E2E suite mocks the API. The real endpoint is covered by the Go
tests and by the measurements above, not by a fixture with seeded
samples.

Co-authored-by: Claude Opus 5.5 <noreply@anthropic.com>
|
||
|
efitenandClaude Opus 5
|
00ee4f9e23 |
fix(coverage): attribute node-discover replies to the responder (#2111)
## Problem A CoreDrive RX companion that runs node-discover gets no coverage on an upstream instance. Reported today by an operator on v3.13.0: the app logged 32 discover replies from one repeater in 16 minutes (`heard 751a49f0c5dadc70 (8B, discover)`), all published, and `client_receptions` stayed at 0 rows for that companion while `client_rx_observations` held 93. Two gaps, both on the upstream side: 1. **Ingestor.** `deriveHeardKey` attributes a FLOOD `path[last]` and a 0-hop advert, and drops a 0-hop `CONTROL/DISCOVER_RESP` (firmware `CTL_TYPE_NODE_DISCOVER_RESP`). The reply carries the responder's own pubkey at offset 6 of the payload, which `decoder.go` already parses into `CtrlPubKey` (#1802), but the coverage path never used it. 2. **Server.** CoreDrive RX asks for `DISCOVER_PREFIX_ONLY`, so the firmware answers with an 8-byte prefix (`simple_repeater/MyMesh.cpp:799-805`). `coverageHeardKeyCandidates` only built the 64, 6 and 4 hex candidates, so a 16-hex `heard_key` would be stored and then matched by no per-node coverage query. ## Change - `cmd/ingestor/client_reception.go`: a third branch in `deriveHeardKey` for a discover response with no hops. Accepts exactly 8 or 32 bytes, nothing truncated, stored with `src='discover'`. - `cmd/server/rx_coverage.go`: adds the 16-hex prefix to `coverageHeardKeyCandidates`. - `docs/client-rx-coverage.md`: documents the `discover` source, the 8-byte keylen and the four-candidate lookup. The leaderboard and `/api/rx-coverage` read `client_receptions` without a key filter, so they pick the rows up without a change. Name resolution goes through `batchResolveHeardKeys`, which is a prefix lookup and handles 16 hex as is. ## Evidence from a deployment that has had this since 2026-08-19 On analyzer.on8ar.eu, `client_receptions` over the last 7 days by `src`: discover 4232, rxlog 4909, geo 548, advert 34. Discover replies are 44% of all coverage rows there (4232 of 9723); on an upstream instance those rows are not written. They cannot be backfilled afterwards either: `client_rx_observations` keeps no raw bytes, so the responder pubkey is gone. ## Tests - `TestDeriveHeardKey` and `TestBuildClientReception` gain discover cases: 8-byte and 32-byte keys accepted (32-byte uppercase input lowercased), a 3-byte and an empty key rejected, a non-discover CONTROL rejected, a discover response with hops not attributed. - `TestHandleClientPacketDiscoverRespWritesReception`: end to end, a raw 0-hop DISCOVER_RESP on the client topic writes one `client_receptions` row with `src='discover'`. - `TestCoverageHeardKeyCandidatesIncludesDiscoverPrefix`: the 16-hex prefix is among the per-node candidates. - Ran locally on Windows: `go test ./...` in `cmd/server` passes; in `cmd/ingestor` everything passes except `TestWriteStatsAtomic_SymlinkAtDestIsReplaced`, which needs the symlink privilege on Windows and fails on clean master too. Not done: no browser validation, as the change is ingestor and server only and the frontend reads the same endpoints. Not included: geographic resolution of 1-byte hops (`src='geo'`) and the RF noise layer, which are separate changes. --------- Co-authored-by: Claude Opus 5 (1M context) <noreply@anthropic.com> |
||
|
n30nex
|
b9fb3d244c |
feat(analytics): split adverts using recorded route evidence (#2088)
Red commits: `dc7dcbe`, `76e3217` ([assertion failures](https://github.com/Kpa-clawbot/CoreScope/actions/runs/37059977385)). Fixes #2041; supplies #2085's backend contract. Records at most two route bits per retained advert. Node flood counts now use the same evidence, including mixed and transport-flood adverts. Analytics failures log/count errors while core observation, path and liveness writes continue. The unrelated recent-advert limit clamp is removed. Direct adverts (empty path) describes the observed remaining path across valid hash widths. Firmware can forward an advert down to an empty path; this cannot establish original send mode or RF distance. The `zero_hop` API spelling remains compatible. Successful post-upgrade evidence writes survive observation replacement and restart. Older overwritten frames and failed writes can leave gaps. The UI explains automatic background backfill. ## Measured validation Synthetic Windows workloads; timings are not production guarantees: - 300K retained adverts, one-hour window: median 64.35→39.84 ms; 13.98 MB→145 KB allocated. Seven-day allocations unchanged; five paired samples. - 1M transmissions/11M observations: backfill 5m43s. Simple 10 Hz writer: all 3,423 observations persisted; p99 28 ms, maximum 323 ms. - Simulated pre-backfill cursor: retained evidence ready 4m21s; full catch-up 6m41s, 122 cache invalidations. Normal completed-migration startup bulk-loads current evidence. Portable opt-in scale tests and window benchmarks are included. All 183 frontend suites, full server tests, targeted races, lint and real-API desktop/mobile checks passed. Full [Linux CI](https://github.com/Kpa-clawbot/CoreScope/actions/runs/37063210229) passed at `36def9c`; three independent reviews are clear. Local Windows testing hit the unchanged symlink-privilege test. No configuration changes. Preflight overrides: external script/OpenClaw profile unavailable; repository checks and Chromium used. |
||
|
n30nex
|
248d2045fd |
test(server): await indexes before node-path regression requests (#2084)
Fixes #2083. Node-path regression tests could request `/paths` while background indexes were still loading, intermittently receiving HTTP 503 instead of exercising hop resolution or sorting. Seven fixture loads now await the existing bounded `WaitIndexesReady` signal. The anchor-bias test uses the same signal instead of polling. This changes five test files only. Production readiness behavior and every HTTP/content assertion are preserved. No dependencies, configuration or customizer changes. ## Validation - Unchanged baseline: 94 passed / 6 failed across 100 targeted executions; failures were actual HTTP 503 assertions. - Fixed setup: 200/200 targeted executions passed. - Parent independently ran the entire server suite: exit 0, 83.4 seconds. - All 183 standalone frontend suites and 20 real Chromium route-map checks passed. - Formatting, whitespace and PII checks passed. TDD justification: test-fixture synchronization repair, with no production logic change. The existing unchanged behavioral assertions supplied the before/after failure proof; no fabricated failing test was added. Local browser checks used Chromium against the unchanged production source; OpenClaw profile/external preflight were unavailable. The unrelated ingestor symlink test requires a Windows privilege absent locally; Linux CI validates that suite. Final CI must pass before merge. |
||
|
|
6d3da77b67 |
perf(channels): coalesce concurrent GetChannels/GetEncryptedChannels cache misses (#2059)
Fixes #2029. ## What was wrong `GetChannels`/`GetEncryptedChannels` (`cmd/server/db.go`) cache their region-scoped result for 60s but had no request coalescing on a cache miss, so every request that arrived while the cache was cold or expired ran the region-scoped `GROUP BY` scan itself. Measured on production: 5 concurrent requests for the same never-cached region each took ~8s, no cheaper than 5 independent runs. `statsSF`/`regionMembershipSF` already fix the identical bug class elsewhere in this file (#1910), so this wraps both functions' query-build/execute/cache-populate block in a `singleflight.Group` the same way, keyed per region, double-checking the cache inside the flight in case a previous winner already refreshed it. ## Tests The review on #2029 pointed out that a timing-based check ("finish within ~2ms of each other") doesn't actually prove coalescing happened — it would pass on a fast machine even without singleflight. `db_channels_singleflight_test.go` uses a call counter instead, same pattern as `TestEnsureNeighborGraph_Singleflight` (#1203 Pair A): - `TestGetChannels_SingleflightCoalescesQueries` / `TestGetEncryptedChannels_SingleflightCoalescesQueries`: 10 concurrent callers against a cold cache, asserting the real query runs exactly once. A test-only hook (`channelsQueryHook`/`encChannelsQueryHook`, nil in production, same contract as `bgLoaderEntryHook`) increments the counter right where the query executes, since these functions hit `db.conn.Query` directly rather than going through an injectable builder function. - `TestGetChannels_SingleflightPerRegion`: two regions queried concurrently (5 callers each) assert 2 queries, not 1 — pins that the flight is keyed per-region and a caller for one region can't receive another region's coalesced result. Anti-tautology: reverting `channelsSF.Do`/`encChannelsSF.Do` back to a bare call makes the coalescing tests observe N instead of 1. `go build ./...`, `go vet ./...`, `gofmt -l .` clean. Full `cmd/server` suite (race-enabled for the new concurrency tests) run in a `golang:1.22-alpine` container, mounted repo, workdir `cmd/server` so the sibling `internal/*` replace directives resolve: ``` === RUN TestGetChannels_SingleflightCoalescesQueries --- PASS: TestGetChannels_SingleflightCoalescesQueries (0.06s) === RUN TestGetChannels_SingleflightPerRegion --- PASS: TestGetChannels_SingleflightPerRegion (0.05s) === RUN TestGetEncryptedChannels_SingleflightCoalescesQueries --- PASS: TestGetEncryptedChannels_SingleflightCoalescesQueries (0.07s) ``` Full suite: `FAIL github.com/corescope/server 98.261s`, but the only failures are `TestHandleNodePaths_PrefixCollision_1352`, `TestHandleNodePaths_FallbackUniquePrefix_1352`, and `TestHandleNodePaths_FallbackUnresolvableHop_1352`, all failing on a `503 {"error":"index loading","retryAfter":5}` — an index-build race in this container's timing, not this change. Confirmed by running the same three against an unmodified, freshly-cloned `master` in the same container: they fail there too (plus `TestHandleNodePaths_PrefixCollision_1352_FallbackBranch`, which this run happened not to hit). Nothing in this diff touches node-path handling. ## Not done The deeper query-plan issue flagged in #2029 (the outer scan is driven by `payload_type`, not region, so a cold solo request still costs several seconds regardless of concurrency) is filed separately as #2058, with `EXPLAIN QUERY PLAN` output and row counts against production data. Coalescing makes one slow query serve everybody; it doesn't make the query itself fast. 🤖 Generated with [Claude Code](https://claude.com/claude-code) Co-authored-by: anieto <anieto@meshtexas.org> Co-authored-by: Claude Sonnet 5 <noreply@anthropic.com> |
||
|
liquidraverandClaude Opus 5
|
b695b979a2 |
fix(nodes): keep paginating past a page that post-LIMIT filtering shortened (#2061)
## Problem `handleNodes` runs the geo-filter, `nodeBlacklist`, `hiddenNamePrefixes` and area passes **after** the SQL `LIMIT/OFFSET`, and rewrites `total` to the filtered length. A page that loses a row is therefore short **without being the last page**, and neither the page length nor `total` can tell a client whether to ask for another page. #1606 added the pagination loop and chose the page length as the canonical stop. That is correct only where nothing is ever filtered. Everywhere else the list truncates at the first filtered page boundary and strands every node behind it — the #1598 symptom reached by a different route: a node that is relaying right now simply stops being in the list. The comment at `app.js:240` rejects `total` for exactly the right reason, then picks the signal the same code path also breaks. ## Measured on a live 2346-node deployment Page sizes for the query the map issues: ``` offset=0 returned=500 ← full, loop continues offset=500 returned=499 ← one row filtered AFTER the LIMIT → loop STOPS offset=1000 returned=500 ← never requested offset=1500 returned=500 ← never requested offset=2000 returned=345 ← never requested ``` | stop rule | requests | nodes reached | |---|---:|---:| | short page (master) | 2 | **999** | | `has_more`, else empty page | 6 | **2344** | **1341 nodes, 57%, unreachable through the UI.** ### One hidden node truncates the whole list The deployment this came from has no `geoFilter` (`/api/config/geo-filter` returns `polygon: null`) and no `nodeBlacklist`. It has a single `hiddenNamePrefixes` entry — a deliberate operator choice — and exactly one node whose name starts with it: ``` public_key d4a46ea2…1054 (64 clean hex chars) name 🚫🔥☀️ role repeater last_seen 2026-09-22T10:09:38Z ``` `handleNodes` drops that row in the `IsNameHidden` pass, which runs after the SQL `LIMIT`. The row is counted by the `LIMIT` and by `COUNT(*)`, so the page it lands in comes back exactly one short — and stops every client that treats a short page as the end. Isolated against SQL on the same database, seconds apart: ``` SELECT lower(public_key) FROM nodes ORDER BY last_seen DESC LIMIT 500 OFFSET 500 -> 500 rows GET /api/nodes?limit=500&offset=500 -> 499 rows comm -23 sql.txt api.txt -> d4a46ea2e99cab132a3286ef3d9cce9099318790af7f25671fe83de453721054 ``` Deterministic — `offset=500` returned 499 on three consecutive requests. Not a CDN artifact either: `cf-cache-status: DYNAMIC`, origin `cache-control: no-store`, no `age` header, and four requests with deliberately unique cache keys all returned 499. So **one deliberately hidden node makes 1341 of 2344 nodes unreachable.** The hiding feature does exactly what it was asked to do for that one node, and takes 57% of the network with it, silently. A single `hiddenNamePrefixes` entry is enough; no geo-filter, blacklist or area filter is needed to reach this state. ### The cutoff moves, which is why this reads as intermittent The visible set is the sum of the pages up to and including the first short one, so the boundary sits wherever the unreturnable row currently sorts by `last_seen`, and jumps a whole page as ingest reorders the list. Same deployment, same code, same config, ~2h apart: | dropped row's rank | first short page | nodes visible | |---|---|---:| | inside 0–499 | page 1 | 499 | | inside 500–999 | page 2 | 999 | A node is visible or invisible purely by where it lands relative to that moving line, so affected nodes appear to vanish and return on their own. Two operators on this deployment reported exactly that, independently, while I was measuring. ### A named reproduction `HU-ZA-Lentihegy` (`5287a33f…`), reported missing from the map by an operator whose companion had logged its advert at 04:20 local the same morning. Ingest was fine. The row is in `nodes` with `last_seen` `2026-09-22T02:20:35Z` — the same advert, to the second — valid GPS, role `repeater`, 1033 adverts, and `/api/nodes/search?q=lentihegy` returns it. ``` rank by last_seen : 1081 cutoff at the time: 999 ``` It missed by 82 positions. Walking the same live endpoint, same moment: | stop rule | requests | nodes reached | Lentihegy | |---|---:|---:|---| | short page (master) | 2 | 999 | **not reached** | | `has_more`, else empty page | 6 | 2340 | reached | The practical shape of this on a busy mesh: 1081 nodes had been heard more recently than 9.4 hours, so on that deployment **anything last heard more than ~9 hours ago was invisible**, alive or not. `#/nodes` compounds it — its search box filters client-side over the truncated set, so the server-side `?search=` never runs and an operator cannot find the node by searching for it either, even though the endpoint would return it. ## Change **Server** — `NodeListResponse` gains `has_more`, computed from the raw SQL page against the real `COUNT(*)` before the filter passes run, so it survives them: ```go hasMore := offset+len(nodes) < total ``` Always emitted (no `omitempty`) so a client can tell `false` from an old server. No extra request in the fixed path: `has_more` ends the loop exactly, where the old rule needed a probe page. **Clients** — `app.js` `fetchAllNodes`, `nodes.js` `loadNodes` and `area-map.html`'s inline helper stop on `has_more`, falling back to a zero-length page against a server that predates it. An empty page always ends the loop, so a `has_more` against a concurrently-shrinking table cannot spin to `safetyCap`. Left alone: the three loops are still three copies. Collapsing them onto `fetchAllNodes` is a bigger change than this fix needs, and `nodes.js` has its own inter-page progress UI. Happy to do it separately if you want it. ## Testing - **Unit** (`tests/unit/test-fetch-all-nodes-pagination.js`): the fixture now models the real handler — a row counted by the LIMIT and by `COUNT(*)`, then removed from the page. Three new cases. Fails on the old rule at 499 of 1199. - **E2E** (`tests/e2e/test-map-nodes-pagination-e2e.js`, already wired into `deploy.yml`): the mock drops a page-1 row and emits `has_more`. Mutation-checked — restoring master's stop rule fails 3 of its steps. - **Go** (`cmd/server/nodes_pagination_has_more_test.go`): asserts `has_more` stays true on a page filtering shortened. Mutation-checked — recomputing it after the filter block fails the test. - Full server suite `go test -race`: ok, 41.4s. `gofmt` clean, `go vet` passes. - **Against a real binary**, not just mocks: fixture DB migrated with `corescope-migrate`, `hiddenNamePrefixes: ["SKCE"]`, `limit=3`. Page 1 returns 2 of 3 with `total` rewritten to 2 and `has_more=true`. Walking the real server with master's rule reaches 2 nodes; with `has_more`, all 199 visible of 200, the hidden one still hidden. The real frontend against that server loads 199 with no JS errors. Two existing expectations changed, both deliberate: 1. `surfaces ALL nodes past the 500 server cap` — 3 → 4 requests. That mock emits no `has_more`, so the 200-row final page can no longer end the loop (a short page is exactly what a filtered page looks like) and a zero-length probe follows. Against a current server `has_more` still ends it at 3. 2. `rows missing public_key are NOT collapsed into one` — its stub returned a constant body, which would now be paged to `safetyCap`. It serves one page then empties. Local `test-all.sh` exits 1 on two XSS-gate self-tests (`good-2-tested.js`, `good-4-tested.js`) via a `UnicodeEncodeError` printing an emoji under Windows cp1252. Identical on clean `origin/master` in a scratch worktree, so it is pre-existing and platform-local, not this branch. There is a second identical filter block further down `routes.go` on another list endpoint. Likely the same class; not touched here. If you would rather land your own version of this, say so and I will close mine. 🤖 Generated with [Claude Code](https://claude.com/claude-code) Co-authored-by: Claude Opus 5 <noreply@anthropic.com> |
||
|
efitenandClaude Opus 5
|
61f565c606 |
fix(node-health): credit zero-hop adverts as direct reception (#2064)
Reported by @dborup on #2057. The mechanism is real; the suspected scale is not. Both parts measured below. ## The defect `directHeardNode` rejects every non-flood route type before it looks at the path, so the `hop == ""` branch that credits an advert's originator can never run for a direct route. Zero-hop adverts — the clearest direct-RF evidence the network produces — are discarded and the node is listed under "Seen via relay" instead. ## Firmware Read at `0679dbef` rather than taken on trust: - `Mesh::sendZeroHop` sets `ROUTE_TYPE_DIRECT` and `path_len = 0`, commented there as "path_len of zero means Zero Hop". The transport overload does the same with `ROUTE_TYPE_TRANSPORT_DIRECT`. - `examples/simple_repeater/MyMesh.cpp` sends the periodic **local advert** through it (the `next_local_advert` branch), as does `sendSelfAdvertisement` when `flood` is false. - `examples/companion_radio/MyMesh.cpp` does the same for a companion's own advert. An ADVERT arriving on a direct route with an empty path therefore cannot have been forwarded: the observer received the advertiser's own transmission, and the advert carries its pubkey in the clear. Every other direct case keeps #2057's rule. A non-empty path on a direct route is the **remaining** route, because the forwarder ran `removeSelfFromPath` before retransmitting, and `advertOriginPubkey` already returns `""` for any payload type other than ADVERT — so the payload guard costs nothing. ## Measured, 7-day window on a production instance | | | |---|---| | zero-hop advert observations currently dropped | 8,166 | | distinct nodes they evidence | 139 | | node-observer pairs they evidence | 185 | | pairs **not** already credited via an empty-path flood advert | **52** | | pairs currently credited from flood adverts | 217 | So the fix restores 52 node-observer pairs of direct evidence that are invisible today, roughly a quarter more advert-based direct evidence. ## What it does not explain The report suspected this accounts for #2057's low headline numbers ("NL-BXE-RP01 | 433 → 0", 234 of 1,860 nodes with any direct observer). The measurement does not support that: - Of 30 sampled nodes with zero-hop advert evidence, **29 already show at least one direct observer**, because they also send flood adverts which #2057 credits. - **NL-BXE-RP01 | 433 has zero zero-hop adverts** in the window. Its empty list is not caused by this rule. So this mostly enriches lists that are already non-empty, and flips few cards from empty to populated. Worth doing on correctness grounds, not as a fix for the counts. ## Tests Four cases added to the `TestDirectHeardNode` table, which previously covered direct routes only with `PayloadTXT_MSG`: - direct + ADVERT + empty path credits the advertiser - transport-direct + ADVERT + empty path credits the advertiser - direct + empty path + **not** an advert credits nobody - direct + ADVERT + **non-empty** path credits nobody The last two matter as much as the first two: they pin the exception to exactly the shape the firmware guarantees. `gofmt` clean. Go tests not run locally (no cgo toolchain on this machine since #1992, and per AGENTS.md `CGO_ENABLED=0` builds a stub that proves nothing), so CI is their first run. ## Related #2063 fixes the empty state's wording on the same card, which asserts the node is out of range when the data cannot establish that. The two are independent: this one adds evidence, that one stops overclaiming when there is none. Co-authored-by: Claude Opus 5 (1M context) <noreply@anthropic.com> |
||
|
efitenandClaude Opus 5
|
b614badb85 |
fix(packets): give each observation its own wire bytes in the detail API (#2055)
Closes #1999. ## The defect, measured on a production instance Packet `96d716f18d885e78` on a live deployment, read from the deployed build's own API: | | | |---|---| | observations in the response | 60 | | distinct `path_json` values | 50 | | distinct `raw_hex` values returned | **1** | | distinct frames actually stored in SQLite | **51** | The contradiction the issue describes, from that same response: ``` obs 38410791 path ["58C0","1403","50C7"] -> hex 094258C01403AF37E39624E548FB7575F195A0BF ``` Three hops in the path, two path bytes in the frame. The bytes belong to the 2-hop observation and are served for all 60. Across the 3000 most recent transmissions on that database: 1977 have more than one observation and **1844 of those (93%) hold genuinely different frames**. 32659 of 36133 observations (90%) differ from their transmission's canonical bytes. This is the normal case, not an edge case. ## Cause The store deliberately does not retain `obs.RawHex`. #881 dropped it as a memory optimisation, ~98MB measured on a 1.7M-observation store, on the assumption that one content hash implies one frame. The firmware hashes payload and type independently of the relay path, so that assumption is false. Worth adding to the issue's diagnosis: all four load and ingest paths in `cmd/server/store.go` still `SELECT o.raw_hex` and scan it into `obsRawHex`, then use it nowhere — LoadAll, loadChunk, `IngestNewFromDB` and `IngestNewObservations`. The bytes are read out of SQLite and discarded, so a cold load pays the transfer for nothing. ## The fix Keeps the memory saving and reads the bytes back only where a human is looking at one packet. - **`cmd/server/db.go`** gains `ObservationRawHexForHash`: one query returning the stored frame per observation id. Two indexed lookups regardless of observation count — `transmissions.hash` through the prepared `stmtTxByHash` (`idx_transmissions_hash`), then `observations.transmission_id` (`idx_observations_transmission_id`). Guarded by `hasObsRawHex`, because #881 made the column optional and the query would be a SQL error without it. - **`cmd/server/routes.go`** backfills in `handlePacketDetail`: once per request rather than once per observation, and after the store lock is released. Bytes already present are never overwritten, and an observation with no stored frame still falls back to the transmission's. Against the acceptance list: observation bytes exposed with canonical as fallback only ✓; the store's memory optimisation untouched ✓; bounded indexed reads with no query per observation and no work under the store lock ✓; startup-loaded, newly ingested and DB-fallback details all covered, because both the store path and the DB path converge on this one backfill and both key observations by an int `id` ✓. **No frontend change is needed.** `public/packets.js` already spreads the selected observation over the packet (`{...pkt, ...currentObs}`) and already reasons about per-observation bytes: the comment there says "post-#882 per-obs raw_hex with a different path length than the top-level packet's raw_hex still gets accurate byte highlights". The client was built for this and has been receiving 60 copies of one frame. ## Tests `cmd/server/obs_raw_hex_test.go`: - the per-id mapping, with three distinct frames and a fourth observation storing none - the `hasObsRawHex` guard, so a schema without the column is not queried - the handler regression: each observation carries its own frame, the frameless one falls back to the canonical bytes, and at least three distinct frames come back across four observations — the last assertion so that a regression to repeating one frame fails, rather than passing on shape ## Verification `gofmt` clean. **Go tests were not run locally**: no cgo toolchain on this machine since #1992, and per AGENTS.md `CGO_ENABLED=0` builds a stub that proves nothing. CI is their first run. Browser validation per AGENTS.md rule 2: I verified **the defect** in a real browser and through the deployed API, with the numbers above. I could **not** validate the fix in a browser, because the change is server-side Go and is not deployed anywhere yet. Saying so rather than claiming otherwise. ## Not done - The four scan sites that fetch `o.raw_hex` and discard it are left alone. Removing the column from those query builders would stop transferring roughly ten frames per transmission on every cold load, but it touches four builders and their `scanArgs` alignment and is not needed for this defect. - `fetchResolvedPathForObs`, immediately next to this code in `enrichObsWithTx`, does run one query per observation. This change deliberately does not copy that pattern, and does not fix it either. --------- Co-authored-by: Claude Opus 5 (1M context) <noreply@anthropic.com> |
||
|
efitenandClaude Opus 5
|
d1b615fc0d |
fix(node-health): list only observers that heard the node on air (#2057)
Closes #2056. ## What changes The node detail "Heard By" card now lists only observers that received the node's **own transmission off the air**, and reports the rest as a count. ``` HEARD BY — DIRECT (8 OBSERVERS) OBSERVER REGION PACKETS AVG SNR AVG RSSI BE-DUF-SiSCD-01 — 16276 7.9 dB -108 dBm BE-BRU-Moris repeater — 13775 -5.6 dB -122 dBm ... Seen via relay by 29 observers. Those observers heard a repeater that forwarded this node's traffic, not this node. ``` and for a node nothing hears: ``` HEARD BY — DIRECT (0 OBSERVERS) No observer is within radio range of this node. Seen via relay by 2 observers. … ``` ## The rule, and where it comes from Read out of the firmware rather than assumed: | | | |---|---| | `Packet.h:83` | `setPathHashSizeAndCount(sz,n) { path_len = ((sz-1)<<6) \| (n&63); }` — hash size rides in the packet's `path_len` byte | | `Mesh.cpp:649,678` | only `sendFlood()` sets it, so the **originator** decides; `CommonCLI.h:69` defaults `path_hash_mode = 0`, i.e. one byte | | `Mesh.cpp:349` | a forwarding repeater appends its hash with the packet's size — it cannot upgrade a packet, and the **last hop is who was heard** | | `Mesh.cpp:89,103` | on a direct route a forwarder matches the head of the path and calls `removeSelfFromPath` before retransmitting, so the path is the **remaining** route and the transmitter is not in it | So an observation credits exactly one node: 1. Route type must be `ROUTE_TYPE_FLOOD` or `ROUTE_TYPE_TRANSPORT_FLOOD`. Direct routes never qualify (38% of transmissions over 7 days). 2. Empty path → the originator, known only for ADVERTs. 3. Otherwise the last hop. 4. The hop must resolve to exactly one candidate. Same gate `resolvePathForObsColdLoad` already applies: under-attribute rather than guess. It drops 418,530 of 1,455,721 flood observations with a path over 7 days (28.8%), and it is what stops the wrong-band credits. ## Measured effect | node | before | after | |---|---|---| | BE-BRU-Moris | 36 observers | 3 | | BE-KRO-RP01 \| ON1KW | 40 | 3 | | BE-BRE-ON8AR | 38 | 2 | | NL-BXE-RP01 \| 433 | 35 | 0 | Network-wide over 7 days, 234 of 1,860 nodes have at least one direct observer (161 have exactly one, maximum 8). The direct list is therefore empty for most nodes, with the relay count below it. That is the correct reading: no observer is in radio range of them. Independent corroboration on staging: for BE-WIL-3EIK-01 the eight direct observers are exactly the top eight entries of its Neighbors table by score and observation count. ## Perf justification `GetNodeHealth` is fast today precisely because it never walks observations — it uses one representative observation per transmission. Direct-RF needs the per-observation path, and that cannot be a per-request walk: the reference store holds **232,928 transmissions / 2,887,861 observations**, one node's `byNode` slice alone holds **55,458 transmissions / 1,450,544 observations**, and `/api/nodes/bulk-health?limit=200` would multiply that. So the aggregate is rebuilt by a background recomputer on the existing `newAnalyticsRecomputer` pattern, published into an `atomic.Value`. Reads are `O(direct observers)`, which is **cheaper than before** — the old code built per-observer sums over every transmission in `byNode` on every request. Proof, `BenchmarkBuildDirectHeardIndex`: ``` BenchmarkBuildDirectHeardIndex-12 1 63067900 ns/op ``` 3,000,000 observations (60,000 transmissions × 50 observations, 8-hop paths, 64 candidate repeaters) in **63 ms**, once per recompute interval. Per observation the walk does one route-type check, one backward scan of `PathJSON` for the last quoted token (no allocation, no `json.Unmarshal`), one prefix-map lookup and one counter update. Rebuilding wholesale also means eviction needs no bookkeeping: a pass simply does not see evicted transmissions. The alternative — a field on `StoreObs` updated incrementally — would have needed the call at five construction sites (`store.go:942,1264,2854,3179`, `chunked_load.go:609`), which is the duplication that caused #1558, plus matching decrements at eviction. ## API Both `GetNodeHealth` and `GetBulkHealth` carried a near-identical copy of the observer loop; they now share one builder. - `observers` — direct-RF only. Same field names, so no client migration. Rows are a named `HealthObserverRow` instead of `map[string]interface{}` (one fewer occurrence in a touched file, per the AGENTS.md ratchet). - `relayObserverCount` — new integer, observers that saw traffic through the node without hearing it. `stats.totalPackets` and `stats.avgHops` still count relayed traffic, so without this number the card would contradict the figures printed beside it. `docs/api-spec.md` is updated for both endpoints. It also documented an `iata` field on these rows that the endpoint has never emitted; removed. ## Tests - `cmd/server/direct_heard_test.go` — table test over the rule: flood with empty path and known originator, flood whose last hop is the node, flood whose last hop is another node, direct and transport-direct routes (never credit), ambiguous last-hop prefix, listener-only candidate, 1-byte and 2-byte hop sizes; plus aggregation and row-building. - `cmd/server/node_health_direct_rf_test.go` — end-to-end through the handler: an observer that only saw relayed traffic must not appear in `observers` but must be counted in `relayObserverCount`. Plus the benchmark. - `tests/unit/test-direct-rf-heard-by.js` — slices the card template out of `public/nodes.js` and evaluates it, so it tests the shipped markup rather than a copy: heading, empty state, relay line, singular/plural, signal columns, listener/repeater badge tri-state. - `cmd/server/node_health_can_relay_case_1290_test.go` — updated to seed a genuinely direct reception, since a relay-only observer no longer carries a badge. - `cmd/server/analytics_recompute_after_load_test.go` — recomputer count 10 → 11. Verified locally: `cmd/server` suite green, `sh test-all.sh` green (180 suites), `tests/e2e/test-e2e-playwright.js` 131/134 passed with 3 skipped and 0 failures against the seeded fixture, plus `test-issue-1147-section-order-e2e.js`, `test-issue-1151-orphan-separators-e2e.js` and `test-issue-1281-location-row-e2e.js`, which all assert on this card. `gofmt` clean, `vet` clean across all modules. Browser-validated on staging: both the full detail page and the side pane, on a node with 8 direct observers and on the 433 MHz node with none. No console errors. ## What this does not do `prefixMap.resolveWithContext` still guesses on ambiguous hops, so paths, neighbor edges and analytics keep their current attribution. Making it abstain is a much larger change and needs its own issue. The "Regions" line and Region column on this card read `o.iata`, which this endpoint has never emitted, so both have always been dead. Left as found rather than widened into this change. Co-authored-by: Claude Opus 5 (1M context) <noreply@anthropic.com> |
||
|
efitenandClaude Opus 5
|
7c6b95ea53 |
fix(store): merge background chunks in order instead of prepending them (#2050)
Fixes #2024. `s.packets` is declared "sorted by first_seen ASC (oldest first; newest at tail)" (`cmd/server/store.go:177`), and retention eviction depends on it: `evictStaleInternal` walks from the head and stops at the first transmission inside the window. A slice out of order is therefore **under-evicted silently** rather than failing loudly. ## What breaks it The background chunk loader. Chunks are windowed on `last_seen` (#1690), so a transmission first heard weeks ago and heard again recently arrives in a *recent* chunk carrying its old `first_seen`. The chunk was then put in front of the slice: ```go s.packets = append(localPackets, s.packets...) ``` and never re-sorted, so the next chunk, which covers an older window, was prepended in front of it and left that ancient row sitting behind newer ones. `LoadChunked` re-sorts after its own load; the background merge did not. That asymmetry is the whole bug. It is not a corner case. On a production database, of the **236080** transmissions in a 14 day window, **2071** have a `first_seen` more than a day older than their `last_seen`, and **1848** more than a week. This matters more since #2035: with the accounting fixed, `maxMemoryMB` actually triggers, and a walk that stops early works against it. ## The fix `mergeChunkIntoPackets` merges the two sorted runs linearly. Re-sorting the whole slice was not an option: this runs under `s.mu` once per chunk, so it would sort hundreds of thousands of packets while ingest waits for the lock. The chunk already arrives sorted, since the chunk query ends in `ORDER BY t.first_seen ASC`, so the `sort.SliceIsSorted` guard is a contract check costing one linear pass that never sorts in production. ## Covered - `TestMergeChunkIntoPackets_KeepsFirstSeenOrder` pins the merge against an interleaving, deliberately unsorted chunk. - `BenchmarkMergeChunkIntoPackets` guards the linear cost, against a future simplification back into a sort. The server suite runs under `-race` in CI and is green. ## Not covered, and I would rather say it than let the PR imply otherwise There is **no integration test driving `loadChunk` end to end**. I wrote one and dropped it: a faithful seed database for that path needs more of the schema and more of the loader's preconditions than the fix itself is worth. Two CI rounds in, the seed was still loading zero packets (the first attempt failed at `OpenDB` on a missing `nodes` table, the second on the window). Both attempts are in this branch's history rather than rewritten away. So the end-to-end claim rests on the code path quoted above and on the production measurement, not on a test that exercises it. The unit test covers the function where the logic now lives, which is the part that can regress. Also not verified locally: `cmd/server` needs cgo for the #1992 driver and this machine has no C toolchain, so CI is the check. --------- Co-authored-by: Claude Opus 5 (1M context) <noreply@anthropic.com> |
||
|
efiten
|
e01565737a |
feat(ingestor): store CoreDrive RX region answers, with position, clock and retention (#2047)
The Scope Audit page said a repeater's declared region list can come from CoreDrive RX while nothing the app sends ever reached it: the client-topic switch handled packets and rf only, so /regions was dropped without a log line, and node_declared_regions is read by region_keys.go and config.go but created by nothing in this tree. #2044 found that gap and proved it against a live instance. This lands the implementation that has been carrying the feature in production on the ON8AR fork since 2026-09-06, the instance CoreDrive RX publishes to. Measured there: 1840 answers about 275 repeaters from 51 collectors, 2026-08-18 to 2026-09-19. Beyond storing the answer it keeps three things the first version did not: position (lat, lon, pos_acc_m, filled on 1263 of 1840 rows, with acc_m dropped when the fix it qualifies was rejected), repeater_clock (filled on all 1840, so a wrong repeater clock cannot make an answer look newer than it is), and retention with per-collector history (pruneOldClientDeclaredRegionsAt bounds by age instead of keeping one row per target). On that dataset 138 of 275 repeaters have answers from more than one collector and 40 have collectors that disagree about the region list, which is the signal the Scope Audit exists to surface and which only survives while more than one answer does. It gates on its own clientRegions block rather than riding on clientRxCoverage, so region answers can be accepted without GPS-tagged reception uploads, and AES block padding is trimmed from region names on ingest. Taken from #2044 with the author credited as co-author: declaredRegionsTablePresent() and its test, a real bug this version lacked (supervisord starts both processes together, so a server that probes first ignores every answer until its next restart), and the docs/client-rx-coverage.md section. Ported by cherry-picking the fork's nine commits rather than retyping, so this is the code that has been running. CI run 35434151026 is green: server ok 80.177s, ingestor ok 99.413s, race detector ok 112.406s, no --- FAIL lines. Merged by the interim maintainer without a second human reviewer: CI and the production figures above are the independent checks. |
||
|
efiten
|
aabeda0f2c |
test(server): set the #1239 lock-hold threshold from measurement, 150µs to 5ms (#2039)
TestComputeAnalyticsDistanceLockHoldDuration failed on two consecutive master commits ( |
||
|
Alex B
|
e6323ec587 |
fix(store): account path, decode-cache and dedup-key bytes so maxMemoryMB eviction triggers (#2035)
trackedBytes undercounted the packet store by about 2.5x, so packetStore.maxMemoryMB never triggered: a tx was charged at creation, before pickBestObservation set its path, so the byPathHop and spTxIndex costs were never added, and eviction then re-estimated with the path known and subtracted more than had been added, drifting the total downwards. The ParsedDecoded cache, the obsKeys dedup key and several per-observation strings were not estimated at all. StoreTx.accountedBytes now records what was charged, rechargeTx returns the delta after every pickBestObservation, and eviction subtracts accountedBytes instead of re-estimating. Measured by the author on a production database copy: trackedMB 151 against 402 MB of heap in use before, 351 against 396 MB after, with GC cycles dropping from ~0.71/s to ~0.011/s over 12 h on their instance. Reviewed by auditing the accounting rather than the arithmetic: all six production pickBestObservation sites recharge, all three subtraction sites read accountedBytes, every recharge site holds s.mu (Load from :857, the two ingest paths at :2778 and :3142 with deferred unlocks), observations are charged only after acceptance, and no charged tx is discarded during the chunk merge. That lock audit is the independent check, because CI's race job covers the ingestor only. Operator impact, both from the estimate growing rather than any limit moving: where maxMemoryMB is set, eviction now caps the real store size, and the cold load clamp drops about a third of the boot walk (124420 to 84374 packets at 650 MB). Where it is unset, which is the default, the change is inert. docs/go-migration.md claimed the Go server ignored the setting, which was never true, and is corrected here. Merged by the interim maintainer without a second human reviewer: CI (run 35258839322) plus the review above are the independent checks. |
||
|
Sylvain Rabot
|
a2ea18f778 |
perf(sqlite): swap modernc.org/sqlite for mattn/go-sqlite3, cross-built with zig (#1992)
Swaps the SQLite driver from `modernc.org/sqlite` (pure Go, SQLite
3.46.0) to `github.com/mattn/go-sqlite3` (cgo, bundled SQLite 3.53.4),
and pays the resulting cross-compilation cost with `zig cc`.
Draft because the riskiest part of this deletes rows — see [Please
review this part first](#please-review-this-part-first) — and because
three things remain unverified at the bottom.
`modernc.org/sqlite` is a transpilation of the C amalgamation. This repo
is read-heavy: `cmd/server` chunk-loads a graph at startup and fans out
neighbour/topology/analytics queries per request, and it pays for that
transpilation on exactly those paths. Head-to-head on the same
120k-transmission / 240k-observation database, running our own hot-path
SQL under both drivers (Apple M4, `-count=5`, medians):
| workload | modernc | mattn | |
|---|---:|---:|---|
| chunk load (`chunked_load.go` v3 join, 20k tx) | 449ms | 196ms |
**2.3×** |
| aggregate scan (240k-row join + `GROUP BY`) | 276ms | 137ms | **2.0×**
|
| 1500 prepared-statement lookups | 512ms | 403ms | **1.3×** |
Allocations fall with it: 1.12M vs 1.64M allocs and 21MB vs 30MB on the
chunk load.
**Superseded by a production run.** @efiten measured both drivers on a
real instance — 11,077,038 observations, 9.7GB database, 4-core arm64 —
as server-only containers against the same live volume, one at a time,
with round 2 reversing the order so the page cache favours the old
driver:
| | audit 7d | audit 24h | background fill (13 chunks) | start →
/api/health |
|---|---:|---:|---:|---:|
| modernc, round 1 | 16.67s | 2.27s | 130.2s | 16.6s |
| mattn, round 1 | 7.87s | 1.34s | 93.8s | 13.5s |
| mattn, round 2 | 8.15s | 1.35s | 96.4s | 13.0s |
| modernc, round 2 | 13.46s | 2.29s | 137.8s | 15.5s |
Warm, the old driver improves to 13.46s on the 7d audit and still loses
by ~1.8×. Chunk load is ~1.4×. `/api/nodes?limit=500` is 0.039s against
0.037s — nothing.
**So the real gain is ~1.4–1.8× on the paths that matter, not 2–2.3×.**
The shape the harness predicted holds — scans and joins gain, small
lookups do not — which is more reassuring than the magnitude would have
been. Quote these numbers.
**The counterweight**, cold and native on that machine: a build goes
from **52s to 163s**. An instance that builds its own image pays that
per deploy.
## The build is cgo now, and one thing about that is a trap
**`CGO_ENABLED=0` still builds.** mattn links a stub, and the binary
dies on its first query with `go-sqlite3 requires cgo to work. This is a
stub`. A green build is not evidence of anything here, which is why
`AGENTS.md` now says so explicitly. `GOOS=linux go build` genuinely
cannot cross-compile any more.
A new root `Makefile` is the entry point. `make crossbuild` uses `zig cc
-target {x86_64,aarch64}-linux-musl` and links static, so each artifact
stays a single self-contained file and the `alpine:3.20` runtime no
longer depends on the base image's libc at all.
`-Wl,-s` is load-bearing: Go's own `-s -w` does not reach the musl
objects zig links in, and without it the server binary is 19.8MB instead
of 12.1MB.
The Dockerfile keeps its single `$BUILDPLATFORM` builder — still no QEMU
for compilation — and gains a checksum-pinned zig plus BuildKit cache
mounts. The mounts are not a nicety: without them an image build
recompiles the amalgamation from cold and takes over half an hour.
## Please review this part first
`internal/dbschema/dedup_index.go` **deletes observation rows**. It is
the one part of this change that can lose data, and it exists because
the migration exposed a real bug rather than causing one.
`stmtInsertObservation` resolves its `ON CONFLICT` against
`idx_observations_dedup`, which `cmd/ingestor/db.go` only ever created
inside the branch that creates the `observations` table for the first
time. Any database whose table predates that branch never got one, so
the UPSERT had no conflict target. modernc failed on the first insert;
mattn fails at `OpenStore`. Same bug, found earlier.
Creating the index unconditionally repairs it — but the index is what
was supposed to prevent duplicates, so a database that never had it can
already hold rows violating it. **`test-fixtures/e2e-fixture.db` in this
repo holds one.** So duplicates are collapsed first. Refusing is not the
safer option: without the index the ingestor cannot prepare its UPSERT,
so it cannot start at all.
Replaying that UPSERT faithfully is subtler than it looks, and a first
cut of this got it wrong twice:
- `COALESCE(excluded.x, x)` means the **incoming** value wins, so down a
group in id order the survivor keeps the **last** non-NULL value. Taking
the first silently discarded newer readings.
- The UPSERT names exactly five columns (`snr`, `rssi`, `score`,
`raw_hex`, `resolved_path`). Every other column must keep the surviving
row's own value; merging those too invents history the ingestor would
never have written.
Merge, delete and `CREATE UNIQUE INDEX` now share one transaction. Split
apart, a writer inserting a duplicate in the gap fails the index
creation while leaving the deletions committed — rows destroyed and no
index to show for it.
Cost, measured on 2.4M synthetic rows holding 5 duplicates: **4.1s**,
holding the write lock throughout, once, at ingestor startup before MQTT
subscribe. Materialising the duplicate-group scan once rather than per
column took that from 9.7s; the pathological case (400k of 600k rows
duplicated) is 5.7s, slightly worse than the 4.2s it was before that
change.
## Four more behavioural differences
Full detail in `docs/sqlite-driver-migration.md`. Briefly:
**Statement preparation is eager.** modernc's `newStmt` stored the SQL
and compiled lazily; mattn calls `sqlite3_prepare_v2` inside `Prepare`,
so SQL naming a missing table fails at *open*. 59 server tests failed on
this alone, all fixtures with partial schemas. `OpenDB` keeps failing
loudly (#1901; `main.go` gates on `dbschema.AssertReady` anyway) and the
fixtures now declare what they are prepared against via
`ensurePreparable`. This also exposed nine `nodes(pubkey …)`
declarations across seven files, where production has only ever had
`public_key` — lazy compilation had hidden the mismatch for as long as
it existed.
**`synchronous` silently dropped FULL → NORMAL.** mattn defaults it to
NORMAL and executes the pragma unconditionally, where SQLite's own
default (what modernc left alone) is FULL. In WAL mode that weakens
durability under power loss. Pinned in `dbschema.WriterDSN`, which both
writers now share — `cmd/migrate` kept a bare path at first and so
quietly wrote at NORMAL, which is what a second copy of a DSN buys you.
**The DSN dialects are mutually invisible.** modernc understood only
`_pragma=name(value)`, mattn only `_`-prefixed parameters, and neither
errors on the other's form — a driver-only rename would have dropped
every pragma in silence. `_journal_mode=WAL` is also gone from the
server's read handle: modernc ignored it, mattn honours it, and setting
`journal_mode` on a read-only connection is a write. Dropping
`_busy_timeout` with it costs nothing, since mattn already defaults to
5000ms — which means the read handle finally *gets* the busy timeout it
had silently lacked.
**`mode=ro` survives for a non-obvious reason.** mattn always passes
`READWRITE|CREATE` and its amalgamation has `SQLITE_USE_URI=0`; what
makes the URI work is its C wrapper ORing `SQLITE_OPEN_URI` in. So the
#1283/#1289 invariant holds with no build flags — but it depends on the
`file:` prefix. `cmd/decrypt` had been building its DSN without one, so
its `mode=ro` had never applied and a missing path was created
read-write. Fixed in passing; never a migration regression.
## What did not change
No modernc-specific API was in use: no `RegisterFunction`, no
`*sqlite.Conn`, no `sqlite/lib` error constants, no `sql.Register`. No
`time.Time` is ever bound as a query argument, so driver time handling
is not in play. Both drivers convert declared
`DATE`/`DATETIME`/`TIMESTAMP` columns to `time.Time`, so
`/api/dropped-packets` keeps emitting `dropped_at` as RFC3339 — an
earlier draft "fixed" that with a `CAST` and would have been the
regression.
## Tests and CI
New regression tests, each written because something got through without
it:
- `TestEnsureObservationsDedupIndexKeepsLatestValues` — the merge
ordering. The original test used complementary NULLs, which passes
whichever direction you pick, which is why the bug survived it.
- `TestCollapseDuplicatesAndIndexIsAtomic` — a failed index creation
must roll the deletions back.
- `TestOpenStorePragmas` / `TestWriterDSNPragmas` — every writer pragma,
read back through the store's own connection. A separate `sqlite3`
session or the startup log line would prove nothing.
- `TestOpenDBRefusesMissingDatabase` — the read-only invariant, which
now rests on a detail of the driver's C wrapper.
- `TestEnsurePreparableMatchesPrepareStatements` — fails when a new
prepared statement outgrows the fixture helper.
CI gains test execution for `cmd/migrate` and `internal/dbschema`, which
had none and both open the database. A PR-time two-arch build plus an
arm64 QEMU smoke gate is new: the GHCR push is push/tag-only, so without
it nothing on a PR would exercise zig, static musl linking or arm64, and
the first signal would arrive on master. `cache-dependency-path` widens
from 2 of the 5 tracked `go.sum` files to all of them.
`make test` passes across all 14 modules, `cmd/server` also under `-race
-count=2` with no failures and no races. `gofmt` and `go vet` clean.
Release-routing and Dockerfile COPY-invariant gates pass.
## Verified by running
- All 8 cross-builds static and correct-architecture; both arches of the
container image built, exported and run under QEMU, serving
`/api/health` and `/api/nodes` against a 2.9M-observation production
snapshot.
- The `migrate` binary repairing that snapshot's duplicate on bare
Alpine.
- `CGO_ENABLED=0` producing a binary that builds and then fails on first
query.
## Not verified
- ~~The 2–2.3× figures come from a standalone harness, not this load
under the old driver.~~ **Closed** by @efiten's production run above,
which also corrected the multiplier.
- SQLite 3.46.0 → 3.53.4 query-planner differences on queries with no
total `ORDER BY`.
- Sustained live ingest through the new writer DSN, and the duplicate
collapse against a database an ingestor is actively writing to. Verified
against a static snapshot only, and the collapse is measured at 4.1s on
2.4M synthetic rows with 5 duplicates — well short of an 11M-row
instance. @efiten has offered a staging instance taking real MQTT
traffic; **this is the item to close before the PR leaves draft.**
An earlier revision of this branch shipped the dedup merge in the wrong
direction with a green test suite, and review then found three more
things in the same file: the repair gated on an error string, a
non-atomic TEMP table drop aimed at the wrong connection, and a deletion
whose only record was a row count. All fixed in
|
||
|
efitenandClaude Opus 5
|
52b9474d7a |
feat(map): filter repeaters by region name (#1862) (#2022)
Fixes #1862 ## What Adds a **Region Scope** picker to the map controls: pick `#be` and the map keeps the nodes that declare `#be` or were seen carrying `#be` traffic. It combines with the #2006 scope-state filter and persists in localStorage the same way. While a region is picked, a small "Region: #be · reset" chip sits on the map itself, so the filter stays visible when the controls panel is collapsed (the default on phones) and can be cleared from there. ## API `/api/nodes` and `/api/nodes/{pubkey}` gain two fields on repeater/room rows: - `declared_regions`: named regions from the node's newest declared-regions answer, split by the same function the Scope Audit now uses for `declaredRegions` (`splitDeclaredRegions`, `cmd/server/scope_config_state.go`), so both pages list a repeater under the same names. `[]` means it answered and named no region. Absent means it never answered, other roles, no declared-regions source, or the declared-regions lookup failed. - `declared_regions_truncated`: present, and `true`, only when that answer was flagged as truncated, so the list is partial. Never `false`: the `nodes.configured_scope` source does not record truncation, so absence does not mean the list is complete. The observed side reuses `transported_scopes`. Documented in `docs/api-spec.md` and the served OpenAPI spec. ### Why no `?hashRegion=` query parameter The observed side lives in the in-memory store. Filtering it after the SQL `LIMIT`/`OFFSET` would corrupt `total` and paging, and the map pages through `/api/nodes`. Same reasoning as the Data path section of #2001. ## Map behaviour - Filtering is client-side over the nodes `fetchAllNodes` already loaded: no new request. One pass over the loaded nodes to build the picker counts, one Set lookup per node per render. The marker filter is `nodePassesMapFilters` (`public/map.js:219`) and the observer stand-down `observerLayerShown` (`:212`), both exported and tested. - The picker and hint count only nodes with a map position, the same test the marker filter applies first, so a count never promises markers the map cannot draw. - The observer layer stands down while a region is picked, for the same reason it does for the scope-state filter. - The popup lists declared and observed regions separately. A truncated declared answer carries the same `truncated` badge the Scope Audit shows. - Absence is not read as a finding: the hint under the picker says a node left off the map is not proof it lacks the region. ## Tests - Go: `node_declared_regions_api_test.go` covers `declared_regions` on list and detail endpoints, the no-source case, agreement with `/api/scope-audit`, `declared_regions_truncated` (truncated, truncated-empty, complete, configured_scope-only, newer untruncated answer, companion) and the OpenAPI schema. - JS: `test-issue-1862-map-region-filter.js` (30 tests) covers the pure pieces (evidence, counts, options, hint, popup rows, `nodePassesMapFilters`, `observerLayerShown`) and, at page level, runs the registered map page through `init()` and `loadNodes()` in a vm sandbox: picker built from loaded nodes, markers filtered by a stored region, observer pins standing down, popup rows, the change handler persisting, and the chip showing, resetting and rendering its text as text. - Mutation-checked: removing the region check, the observer stand-down, the picker build in `loadNodes`, the popup rows, the persist on change, the chip reset, or the truncated flag (Go or JS) each fails a test. `test-issue-2001-map-scope-state.js` still passes. - `go test ./...` in `cmd/server` passes; `check-css-vars` and `check-xss-sinks --diff` are clean. ## Staging validation Build `c646310f`, Chrome, no console errors: - Picking `#be`: chip "Region: #be · reset" at the top of the map, hint "221 nodes with a map position have evidence for #be: 129 declare it, 191 seen carrying its traffic. Absence here is not proof: ...". - Clicking reset: picker back to "All regions", stored choice cleared, chip hidden. - First version, same instance: `declared_regions` on 136 of 500 `/api/nodes` rows; returning to "All regions" blocked the main thread 5.4 s against 3.2 s for the existing Status filter returning to "All". The review measured the region filter's own added work at about 0.08 ms per render plus popup rows that are already built for every marker, so most of that time is the existing full re-render. ## Not verified - The chip placement at phone width, and on narrow desktop widths where it may sit under the expanded controls panel. - The truncated badge with real truncated answers (staging has none today). - `test-map-clustering.js` has one failing test on `upstream/master` too; untouched here. - Marker badges from the original issue body are not implemented; the popup rows are the per-node display. --------- Co-authored-by: Claude Opus 5 (1M context) <noreply@anthropic.com> |
||
|
efitenandClaude Opus 5
|
efdb3ea0b3 |
feat(analytics): retransmission pressure over time (#1699) (#2023)
## Summary Adds `GET /api/analytics/retransmissions` and a "Retransmission Pressure (proxy)" chart on the Analytics Topology tab, implementing the metric agreed in #1699: for each flood, the number of distinct repeaters in the union of the paths of all its observations (`[A]`, `[A,B,C]`, `[A,D]` gives 4), averaged per time bucket. Topology is the tab that already shows hop counts and repeaters in paths, so the chart sits there instead of in a new tab. ## Definition - Flood routes only (`route_type` 0/1); TRACE excluded. Direct routes carry the route still to travel (firmware `src/Mesh.cpp:78-106,334-342`), zero-hop sends are direct (`src/Mesh.cpp:717-737`), TRACE path bytes are SNR values (`src/Mesh.cpp:59-61`, refused by `sendFlood` at `src/Mesh.cpp:637-641`). Firmware commit 0679dbef. - **Flood events, not hashes.** `transmissions.hash` is UNIQUE and the packet hash excludes the path (`src/Packet.cpp:41-50`), so when the same bytes flood again the observations land on the same transmission. Observations are sorted by time and split into events wherever two consecutive observations are more than 5 minutes apart. Each event is counted on its own and bucketed by its first observation. - Why 5 minutes: a node holds a flood for at most 32 s (`src/Dispatcher.cpp:11,243-251`) plus a random retransmit delay. On live over 7 days, 72,806 of 74,347 flood transmissions span 60 s or less, and of 1,372,283 consecutive observation gaps, 52 fall between 60 s and 300 s against 1,823 above 300 s. - Events that start before the store retention floor (now minus `retentionHours`) are left out for every request shape. The store keeps older observations only for hashes heard again recently, so they do not represent that period. Eviction of those transmissions is tracked in #2024. - A flood event heard only with an empty path counts as 0 repeaters. - **Prefixes are not resolved to nodes, and a prefix counts once per event**, whether it repeats across observations or inside one path. On live (7 days), a repeated 2-byte prefix inside one path occurs in 1.08% of flood transmissions and 6,178 of 6,596 such repeats match exactly one known node; for 3-byte it is 0.69% and 104 of 104. That is one node forwarding again after its 160-slot cyclic duplicate filter dropped the hash (`src/helpers/SimpleMeshTables.h:9,52-57`). A repeated 1-byte prefix (44.9% of 1-byte transmissions) is mostly two nodes; counting it once keeps the value a lower bound. `summary.one_byte_packets` reports how many events that affects. - Observations are stored once per observer and path per hash, so a later event of the same hash only holds pairs not stored before; its count is a lower bound too. On live these are 1,466 of 75,356 events (1.9%), and they are kept in the average. - Resolution was not used: on live, 1-byte observations nearly all have `resolved_path` NULL, and cold load refuses context-based resolution of history (`cmd/server/neighbor_persist.go:155-168`). - Buckets `5m|15m|1h|6h|1d`. `region` filters on observers like `/api/analytics/rf`, after the event split; a region with no known observers is not filtered, the same as the other analytics endpoints. `area` is not supported. ## Implementation - `cmd/server/retransmission_pressure.go:255` `addPath`: scans path JSON directly into a generation-stamped hash set, no allocation per observation. - `cmd/server/retransmission_pressure.go:367` `computeRetransmissionPressure`: one pass under `s.mu.RLock`. Per flood transmission it sorts the observations by cached parsed time into a reused scratch slice, splits events and counts each in `addEvent` (`:319`). O(T + O log k + H). - `cmd/server/retransmission_pressure.go:470` `GetRetransmissionPressure`: default shape from the recomputer (#1659 warm-up gate). Other shapes come from a typed TTL cache (max 64 entries) cleared on new paths and eviction (`cmd/server/store.go:2289,2336`); concurrent misses on one key share one compute through singleflight (`store.go:204`). - `cmd/server/retransmission_pressure.go:515` handler, `cmd/server/routes.go:331`, `cmd/server/openapi.go:108`, `docs/api-spec.md:1283`. - `public/analytics.js:761` card, `:855` `renderRetransmissionChart` (CSS variables only, lines break at missing buckets, caption states it is a proxy, names the observer coverage bias, the once-per-flood prefix rule and the 5 minute event split), `:829` loader with stale-response guard. ## Performance - `BenchmarkComputeRetransmissionPressure`, 50k transmissions x 20 observations, `-cpu 1`, i5-1335U: median 161 ms/op (132 ms/op before the event split); first pass after startup with timestamps not yet parsed 192 ms/op. About 22 KB and 281 allocations per op. - On staging the default shape is served from the recomputer in 0.3 s; the post-load recompute of this recomputer took 994 ms on a 121k-transmission store (log line quoted in #2025). A 336h store would be about twice that, every recompute interval, under the store read lock. ## Tests - `cmd/server/retransmission_pressure_test.go`: union counting (reporter example, overlaps, once per event for 1/2/3-byte, width/case, growth); route/TRACE/zero-hop filter, bucketing, window by event start; event split and the 5 minute settle gap (boundary, chained steps, unsorted input), retention floor; region filter, region applied after the split, unknown region, 1-byte share; recomputer read, TTL cache invalidation on new paths and on eviction, cache expiry, singleflight, recomputer gate wiring, handler, warm-up gate. - `test-issue-1699-retransmission-chart.js` (33 tests, registered in `test-all.sh` and `deploy.yml`). - Mutation-checked: 18 mutations of the event split, floor, prefix rule, bucketing, region order, cache clears, expiry, gate wiring and singleflight, all killed. - `go test ./...` in cmd/server passes; `scripts/check-css-vars.js` OK. ## Staging validation Build `c646310f` (this rework plus #2025 and the other review follow-ups), after a container restart and full load: default shape 74,974 flood events, average 27.08 repeaters, 169 hourly buckets from 2026-09-06 16:00 (the 168h floor) to the current hour, highest hourly average 53.3. Before the rework the same instance showed buckets back to 2026-07-18, averages up to 148, and for the first minutes after a restart only 5,911 packets. ## Merge order with #2025 #2025 fixes the recomputer startup for all analytics endpoints (the stale first snapshot seen here). Whichever of the two merges second has to add `recompRetransmissions` to `analyticsRecomputersLocked`, wire it to that PR's `loadedGate` instead of `LoadComplete`, bump the recomputer count in `TestAnalyticsRecomputers_PostLoadOrder` from 9 to 10, and make `TestStartAnalyticsRecomputers_RetransmissionsGatedOnLoadComplete` call `signalStartupLoadDone()`. That resolution is what ran on staging. ## Not verified - Recompute timing on a production-size (336h) store; only extrapolated. - Phone-width layout and dark theme of the reworked chart. - E2E Playwright suite. Fixes #1699 --------- Co-authored-by: Claude Opus 5 (1M context) <noreply@anthropic.com> |
||
|
|
914bd4cf0e |
feat(channels): show each message's region (#1851) (#2018)
## Show each channel message's region scope Each message in the Channels view now shows the region scope it was sent with, as a small chip in the meta line: the region name (for example `#be`), `unknown scope`, or nothing. This is the channel-message part of #1852 by @dborup, extracted as a focused change. #1852 was closed unmerged because it had grown to the whole fork diff. The implementation follows dborup's commits |
||
|
efitenandClaude Opus 5
|
a059299588 |
feat(node-analytics): hop-count statistics per node (#1812) (#2021)
## Summary
Adds per-node hop-count statistics so repeater operators can choose
`flood.max`, `flood.max.unscoped` and `flood.max.advert` from what their
node actually sees.

- New endpoint `GET /api/nodes/{pubkey}/hop_analytics?days=N`
(`cmd/server/routes.go:299`, `cmd/server/node_hop_analytics.go:312`),
separate from `/analytics` as requested in the issue.
- New card "Hop Count at This Node" on the node analytics page
(`public/node-hop-analytics.js`, wired at
`public/node-analytics.js:130,174`): histogram of hop counts with a box
plot on the same x axis, filters `flood.max` (default),
`flood.max.advert`, `flood.max.unscoped`, driven by the existing range
picker.
- The existing "Hop Distribution" chart is unchanged: it shows path
length at the observer, a different quantity.
- No `direct` tag, although the issue lists one: for DIRECT packets the
path is the remaining route and no flood limit applies, so there is no
hop count to report.

## Hop count definition (firmware 0679dbef)
- `src/helpers/RoutingPolicy.h:15-21`: limits compare
`getPathHashCount()`; `.unscoped` applies to route type FLOOD, `.advert`
to adverts.
- `src/Mesh.cpp:344-350`: `routeRecvPacket` checks with n hashes in the
path, then writes its own hash at index n. So hops = the node's
zero-based index in the path, no +1.
- `src/Mesh.cpp:265-285`: a node forwards a flood once;
`src/Mesh.cpp:651,680`: an originator never forwards its own flood.
- DIRECT packets are excluded: their path is the remaining route
(`src/Mesh.cpp:78-103,334-341`).

Response: `{timeRange, packets: [{hash, timestamp, hops, tags}],
ambiguous}`. Tags: `flood`, `scoped` or `unscoped`, `advert`. Documented
in `docs/api-spec.md:679` and `cmd/server/openapi.go:90`.

## Attribution
`cmd/server/node_hop_analytics.go:198-309`. The result depends only on
the observed paths, the prefix map and the neighbor graph, so it is the
same after a restart as after live ingest.

- Every observation of every flood packet in the window is read.
`byNode` holds the server resolver's pick at ingest and other picks
after a cold load; `byPathHop` indexes only each packet's longest path,
which for a busy relay often runs through another branch of the flood.
- A packet counts when the node's prefix sits at exactly one index
across its observations, and either the node is the only relay candidate
for that prefix (`prefixMap.relayCandidates`,
`cmd/server/store.go:6795`), or the hop resolves to the node under the
ingestor's strict rule (`cmd/ingestor/path_resolver.go:143-214`) in at
least one observation and to another node in none. Strict rule: earlier
hops identified without a tiebreak, exactly one candidate adjacent in
`neighbor_edges` to the previous hop (the originator for hop 0 of an
advert), nodes already on the path excluded.
- The server resolver's tiebreaks (affinity, GPS distance, advert count,
pubkey order) are not used.
- Everything else with the node's prefix goes to `ambiguous`. In
practice that is most packets with a colliding 1-byte path hash.

On a read-only 7-day dump of a 1,669-node mesh DB, for one busy
repeater: 23,081 packets attributed, 11,437 ambiguous. Taking candidates
from `byPathHop` instead gave 9,995 attributed, with the histogram mode
moved from 2 to 3-5 hops.

## Performance
Scans `s.packets` under the read lock, no SQL per packet. Per
observation: one substring test for the node's first prefix byte; the
hop scan only for observations containing it; the strict walk only for
colliding prefixes, with per-request caches for candidates and
adjacency. `BenchmarkNodeHopPackets` models one 7-day request at that
scale (73,782 flood packets, 1,430,280 observations): 44-87 ms/op, 13.4
MB, 40 allocs on a throttling laptop.

Response size for that repeater over 7 days: about 23k entries, 2.3 MB
JSON, 375 KB gzipped. `hash` and `timestamp` are 61% of the raw and 91%
of the gzipped bytes; they stay because the issue asks for them so a
client can join entries to packets and bin by time.

## Tests
- Go: `cmd/server/node_hop_analytics_test.go`: 12 unit tests, a
live-ingest test through `IngestNewFromDB` (a colliding prefix without
independent attribution goes to `ambiguous`, not to the node the
resolver picked), live ingest versus cold load of the same DB, route
test, benchmark. 15 mutations of the attribution logic each fail a test.
- JS: `test-node-hop-analytics.js` (filters, histogram, quartiles and
whiskers with a fixture that separates 1.5 IQR from 3 IQR, render),
registered in `test-all.sh` and `.github/workflows/deploy.yml`.
- `gofmt`, `go vet ./...`, `go test ./...` in `cmd/server`,
`scripts/check-css-vars.js` pass.

## Staging validation
Build `c646310f` (this PR's review follow-up together with the other
open follow-ups), after a container restart and full load, on a busy
Belgian repeater:

- `hop_analytics?days=7`: 23,302 packets, 11,548 ambiguous, median 4,
adverts never above hop 7 (matching the firmware default
`flood_max_advert = 8`, `examples/simple_repeater/MyMesh.cpp:922`), 1.2
s. The first version reported 23,035 packets and 86 ambiguous in 534 ms,
because it trusted the resolver's pick for colliding prefixes.
- The card rendered on the first version with no console errors; the
rework does not touch the frontend beyond a test fixture.

## Not verified
- Response time and lock hold for 30 days on the busiest node on a
14-day store.
- Server relay candidates exclude companions and listeners while the
ingestor's prefix index does not, so a few strict attributions can
differ from the ingestor's persisted `resolved_path`.
- Identical numbers across a second container restart were shown in a Go
test, not repeated on staging.
- Dark theme, phone width, and switching the range picker in the
browser.
- Filter state is not reflected in the URL hash (the range picker is not
either).

Fixes #1812

---------

Co-authored-by: Claude Opus 5 (1M context) <noreply@anthropic.com>
|
||
|
efitenandClaude Opus 5
|
2d4019f719 |
fix(analytics): recompute once the store has fully loaded (#2025)
Refs #2023, #1659, #1724 ### Problem `main.go:258` waits only for the first load chunk, then `main.go:402` starts the analytics recomputers. `Start()` computes immediately on that chunk (`analytics_recomputer.go:86` on master) and the next compute waits a full interval (`:93`, 5 min default). The chunk loader walks by ascending id, so that chunk holds the oldest transmissions. - RF, topology, channels: the #1659 gate checked `LoadComplete()` after the compute (`analytics_warmup_1659.go:122`). `LoadComplete` flips at the end of the hot window (`chunked_load.go:489`), before the background fill (`store.go:1455`), so the gate could open on a snapshot without the background fill, and the 60 s force timeout (`:73`, `:162`) opened it on the first-chunk snapshot. In an end-to-end test on master, `/api/analytics/rf` returned 200 with 8 of 100 packets before the background fill ran. - Distance, hash-collisions, hash-sizes, roles, observers-clock-skew, nodes-clock-skew: no gate, partial snapshot served from the start. - Distance additionally served a snapshot from the previous index for up to one interval after each lazy index build. On a staging instance, a default analytics request returned 5,911 packets with hours-old last buckets until the next recompute (about 74k). ### Change - `StartupLoadDone()` (`chunked_load.go:108`): closed when `RunStartupLoad` returns, on every path (`chunked_load.go:202`). Closing it drops the hash-size info cache (15 s TTL) and the clock-skew engine throttle (30 s, `clock_skew.go:225`), both read by the post-load computes. - `recomputeWhenLoaded` (`analytics_recomputer.go:172`): on that signal, recompute each recomputer once, sequentially, via `RecomputeNow` (`:154`), which runs on the recomputer's own loop and restarts its ticker (`:106`). Order (`:255`): rf, topology, channels, distance, hash-collisions, hash-sizes, observers-clock-skew, nodes-clock-skew, roles (roles reads the nodes-clock-skew snapshot). Logs one line with per-recomputer durations. - Warm-up gate: now the same signal (`:343-354`), sampled before the compute starts (`:129`), so a pass that began on partial data never opens it. 503 + `Retry-After: 5` and the force timeout are unchanged; a forced-open snapshot is replaced by the post-load recompute. - Ungated endpoints: no new 503s (their API has none); snapshot replaced right after the load. - Distance: the lazy index build refreshes the distance recomputer before reporting built (`store.go:4476`). - Recompute intervals and config unchanged. ### Performance One extra compute per recomputer per process start, run sequentially so they do not all hold the store read lock at once. Ticker phases afterwards are offset by the cumulative post-load compute durations instead of all starting within the first-chunk compute window (relevant to #1724; the effect on lock waves is not measured). ### Tests `analytics_recompute_after_load_test.go`: signal open during background fill, closed after success and failure; cache drops; immediate and ordered post-load recompute; gate not opened by a pass started before the load; forced-open snapshot replaced on load; ticker restart; distance refresh before 202 ends; end to end with recomputers started before the background fill (RF 503 until load, then `totalTransmissions` equals the full store; six ungated endpoints 200 during load; all nine recomputed after load). 9 of these failed on master with stubs; 8 single-line mutations each caught. `go test ./...` in `cmd/server` passes. ### Staging validation Deployed together with the review follow-ups of #2015-#2023 (build `c646310f`), container restart: ``` 16:35:20 [store] first chunk ready (chunkSize=10000) 16:35:25 [store] LoadChunked complete ... starting background fill loader 16:36:58 [store] background load complete: 121120/121282 packets in memory (coverage=99.9%) 16:37:03 [analytics-recompute] startup load done: recomputed 10 snapshots in 5.155s (rf=955ms topology=1.684s channels=43ms distance=49ms hash-collisions=30ms hash-sizes=338ms observers-clock-skew=369ms nodes-clock-skew=692ms roles=2ms retransmissions=994ms) ``` Right after that line, `/api/analytics/rf` reported `totalTransmissions` 121,121 against 120,700 packets in memory, and the retransmissions default shape from #2023 covered the full 7 days. Before this change both waited for the next 5 minute tick. ### Merge order with #2023 #2023 adds a tenth recomputer. Whichever of the two merges second has to add `recompRetransmissions` to `analyticsRecomputersLocked`, wire it to `loadedGate` instead of `LoadComplete`, and change 9 to 10 in `TestAnalyticsRecomputers_PostLoadOrder`; the retransmissions gate test then calls `signalStartupLoadDone()` instead of setting `loadComplete`. That resolution is what ran on staging above. ### Not verified - Repeater-enrich recomputer and the region/window TTL caches (hash-collisions region results have a 1 h TTL) may also keep partial results after the load; not changed here. - Recompute order is tested structurally, not with roles/clock-skew data. - Whether this reduces the #1724 stalls; not measured. Co-authored-by: Claude Opus 5 (1M context) <noreply@anthropic.com> |
||
|
efitenandClaude Opus 5
|
7f8f71e773 |
fix(live): reconnect when the websocket goes silent (#1074) (#2020)
## Problem #1074 reports that after a proxy dropped the WebSocket, live updates only came back 8 to 10 minutes later. The client only reconnects from `onclose` (`public/app.js:791` on master). A half-open connection (a proxy or NAT dropping state without a FIN reaching the browser, a laptop that slept) can keep a WebSocket OPEN for minutes without `onclose`, and nothing retries in the meantime. The server does ping every 30s (`cmd/server/websocket.go:252` on master), but ping frames are answered by the browser below the page and JS cannot observe them. The only app-level frames are packet broadcasts (`websocket.go:337, 343, 366`), which stop on a quiet mesh. So the client had no signal to tell a quiet mesh from a dead socket. ## Change Server (`cmd/server/websocket.go`): - On the existing ping tick, `writePump` also writes the text frame `{"type":"heartbeat"}` (`:283`, bytes at `:80`). One 20-byte frame per client per 30s, from the goroutine that already writes the ping, no hub lock. - The interval moves to `Hub.pingInterval` (default 30s, `:118`) so a test can shorten it. Client (`public/app.js`): - Every frame refreshes `wsLastMessageAt` (`:841`). One timer (`checkWSLiveness`, `:806`) fires at last message + `WS_STALE_MS` (75s, one late or lost heartbeat of slack) and replaces the socket if it is still silent. It is armed at socket creation, so a stuck handshake is covered too. - `dropWS` (`:796`) detaches the old socket's handlers before `close()`, so a late close event cannot schedule a second connection. - `connectWS` (`:818`) cancels a pending reconnect and drops the previous socket, so the watchdog, resume checks, `onclose` and pull-to-reconnect cannot stack sockets. Before this, `pullReconnect` on a non-open socket left a third socket 3s later. The 3s `WS_RECONNECT_MS` delay after `onclose` is unchanged (`:837`). - `visibilitychange` (to visible) and `online` run the check immediately (`:861`), because a hidden or sleeping tab's timers can run late. - Heartbeat frames are matched by exact bytes (`:842`) and are not pulsed or dispatched to `onWS` listeners. Compatibility: tabs loaded before the deploy dispatch heartbeats to their listeners until reloaded. Every current listener filters on `msg.type`, so the visible effect is a logo pulse and a `/stats` cache refresh every 30s. Perf: one `Date.now()` and one string compare per WS message on the client; one extra 20-byte write per client per 30s on the server. ## Tests - `test-ws-stale-watchdog-1074.js`: real `app.js` in a vm with a fake clock, timers and WebSocket. 12 tests: silence past the threshold replaces the socket exactly once; a handshake that never opens is replaced; heartbeats and packet traffic keep the socket; heartbeats are not dispatched; resume and `online` after silence reconnect immediately, with recent traffic they do not, and hiding does not trigger a check; repeated resume events open one socket; after `onclose` only the reconnect timer is pending; pull-to-reconnect leaves one socket. 9 of 12 fail on master. 12 of 12 source mutations (threshold, reconnect path, detaching, timer cleanup, resume wiring, heartbeat filter) are caught. Registered in `test-all.sh` and the deploy.yml unit step. - `TestWritePumpSendsAppHeartbeat`: fails with a read timeout without the heartbeat, even with pings every 20ms. `TestHubDefaultPingInterval` pins the 30s interval that `WS_STALE_MS` assumes. - `go test ./...` in `cmd/server` passes; gofmt and go vet are clean. ## Browser validation On a staging instance (build `139e484e`, together with #1979's branch), in Chrome, no console errors: - A `{"type":"heartbeat"}` frame arrived on the open socket within the observation window. - Silent socket: after `ws.onmessage = null`, the page replaced the socket after 76.2s (threshold 75s plus a 250ms poll); the old socket ended in CLOSED, the new one OPEN. - Normal close: `ws.close()` led to a new OPEN socket after 4.1s, and exactly one new `WebSocket` was constructed. ## Not verified - The reporter's proxy setup was not reproduced; that their delay was a half-open socket is a hypothesis consistent with the symptom. Hence `Refs`, not `Fixes`. - Laptop sleep and the `visibilitychange` / `online` resume path were only covered by the unit test, not in a browser. - Behaviour under Chrome's intensive background-timer throttling and mobile tab freezing was not measured; a frozen but healthy tab may do one unnecessary reconnect on resume. - Go tests were run without `-race`. Refs #1074 ## Review follow-up (commit `72e5e906`) An independent review found no blocking bug: all data writes stay on the write goroutine, pong-based dead-client detection still works, and no ordering of onclose, watchdog, resume checks and pull ends with two live sockets or none. It reproduced the silent-socket case in headless Chromium through a blackholing TCP proxy (replacement 75.0 s after the last frame). Changed: 1. **Startup wiring tested.** The first resume test now boots through the page's real `DOMContentLoaded` listeners, so removing `setupWSResumeCheck()` from startup makes it fail. 2. **Wall clock stepping back.** If the clock steps back after the last message, the watchdog no longer re-arms for the size of the step (a 1 h step used to delay detection by about an hour). A negative silence reading is treated as stale, so the socket is replaced within `WS_STALE_MS` of the step (`public/app.js:810-814`). A step in either direction costs at most one extra reconnect on a healthy socket. `Date.now()` stays the clock so a tab resumed after sleep is still checked against real elapsed time. 3. **Pull-to-reconnect at once.** On an OPEN socket, pull-to-reconnect now replaces it through `connectWS()` instead of closing it and waiting for onclose, which took 63 s on a half-open connection in the review's measurement (`public/app.js:927-934`). This was slow on master too; it is safe now that `connectWS()` detaches the old socket. Tests: 12 to 16 in `test-ws-stale-watchdog-1074.js`; `test-pull-to-reconnect.js`, `test-pull-to-reconnect-1091.js` and `test-live.js` pass. Correction to the compatibility note: tabs opened before the deploy treat the heartbeat like any other message. Besides the logo pulse, `app.js` runs `updateNavStats` on every message and invalidates the cached `/stats` and `/nodes` responses 5 s later; `packets.js` also pushes every message into `pauseBuffer` unfiltered (~1310-1313), so an old tab with Packets paused sees its counter rise by 2 per minute. Cosmetic: heartbeats are filtered out on replay, and a reload ends it. Not verified: real hidden-tab or mobile freeze behaviour, Firefox and Safari, and the reporter's proxy setup. --------- Co-authored-by: Claude Opus 5 (1M context) <noreply@anthropic.com> |
